Alastair Thompson Profile picture
Apr 16, 2022 27 tweets 11 min read Read on X
#LaNina #ENSO & drought expectations in Africa - a deep dive into latest satellite imagery and model atmospheric precipitable water data.

Thread...

[image: There is remarkably complex water transport activiy underway over North Africa and the Middle East.]
First some background. ENSO, La Nina and El Nino is an oscillation related to sea surface temperatures in the Eastern Pacific. It is an important indicator of drought activity, especially in the US, but also as far away as Africa and NZ. La Nina typically mean less rain.
The image above shows equatorial tropical atmospheric water flows, and helps with understanding of why the Eastern Pacific sea surface temperature is important. Less convective storms in the Eastern Pacific leads to less atmospheric water everywhere.
The image above shows the last 24 hours of satellite imagery of the globe (albeit in a mercator projection). You can see in it that there is a lot of convection in the tropics, which is generating numerous atmospheric rivers in both the Nth and Sth hemispheres.
The image in the initial tweet is repeated here. Whilst there is a persistent La Nina, and has been for 3 years, there is also a unusually high levels of atmospheric water - just one month after Equinox. This will increase and move northwards through summer.
The next set of tweets contains data observations for what we are seeing in the entire tropical belt. Satellite imagery comes from @zoom_earth and PWAT anomaly data from @weathermodels_. And we start in the eastern Pacific where the La Nina oscillation is measured.
Here is a corresponding model forecast for 16 days for the same area. We will look at the ENSO forecast observations next - but in this model forecast we can see robust levels of atmospheric water vapour over the ocean.
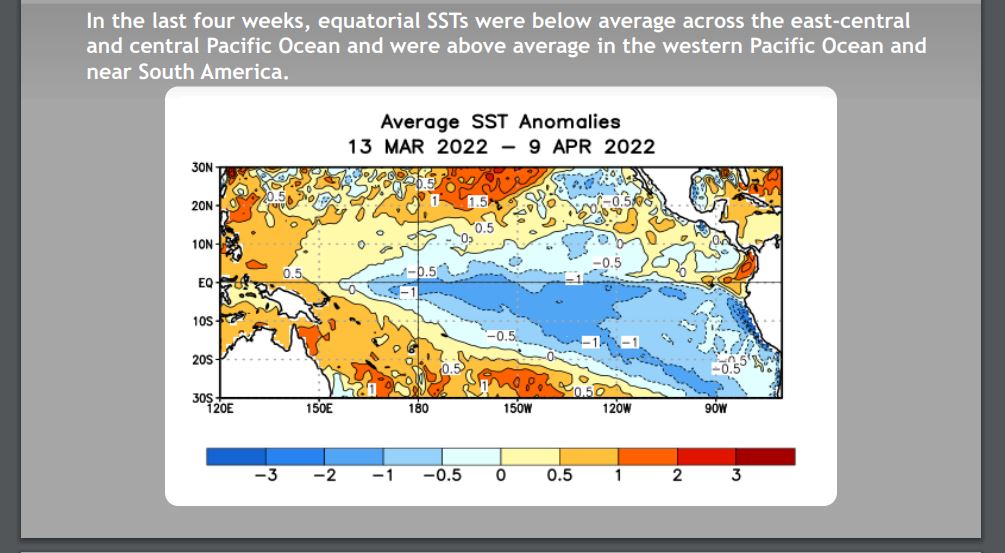
This is the La Nina. A massive area of sea surface temperature anomalies that extends all the way to far western Pacific. These temperatures should be suppressing convection, and therefore aerial water flows.
A full technical ENSO forecast is issued very regularly - because it is so important. The latest one - 2 days old - is here. And its conclusion is that La Nina is present and there is 50% probability of it remaining through to summer solstice. cpc.ncep.noaa.gov/products/analy…
If this happens then this La Nina will last longer than last years. These two slides show:
1. That there are convection anomalies present in the Eastern Pacific (i.e. evidence of suppression by La Nina)
2. A broad range of model predictions on what will happen in current months.
And finally a graphic which shows changes in SSTs over a a four week period March-April. Temperatures are rising in the Eastern & South Pacific - the fastest change however is in the North West Pacific and in the Western Indian Ocean.
I am no ENSO expert. Its a complex business. But the question this thread is seeking to answer is whether the La Nina is resulting in a fall in tropical atmospheric water.

My working assumption is that if it isn't then its capacity to cause droughts is diminished.
Here's a satellite image of the Western Pacific over 12 hours for context. This area is one of the largest convective storm sources of atmospheric water in the tropics. It is where the largest and most intense cyclones on the planet develop.
And the PWAT anomaly forecast for the Western Pacific also shows no sign of PWAT (atmospheric water) in the tropical stream being reduced. It does however show what looks like a major typhoon developing.
Further west we have the Indian Ocean which is thought to be the ocean which is being most impacted by Climate Change - and which current data shows has experienced significant SST rises in the West over the past month.
And in PWAT terms the Indian Ocean tropical area is also strong, spectacularly so, partly because the forecast also shows the impact of a very late tropical disturbance/storm in the South Western Indian Ocean.
This can be seen more clearly in this forecast for PWAT anomaly over Africa. The storm is expected to mainly impact Mozambique but outflows from it appear to be contributing to a burst of unusually high levels of moisture over the Arabian Peninsula.
To complete the picture we have the tropical flows over the Atlantic - where there is a lively interaction between the West African Monsoon and the Amazon Monsoon.
For this area we have 2 PWAT forecasts the 1st for the Tropical Atlantic (equatorial water flow is at the bottom) moving west from the West African Monsoon. This is helping to fuel vigorous atmospheric rivers back across the Atlantic in a Nth Easterly direction.
And our final PWAT anomaly plot shows South America. This time the main westerly tropical flows can be seen towards the top.
I now return to the data which prompted this inquiry. For several days we have seen significant storm activity over the Arabian Peninsula.

This image is from today.

The storms are significantly larger than forecast & caused by Indian Ocean, WAM and Amazon water flows.
And they are forecast to intensify over the coming fortnight. This can partly be put down to a possible cyclone in the Indian Ocean, but this activity has started before that storm exists.
The intense Horn of Africa/East African Monsoon - which brings the main rains to the Nile is not due till July - but significant rains are forecast for the Horn of Africa also over the next fortnight.

And we also see a persistent significant PWAT anomaly over the Sahel.
I have been watching to see whether rains in this particular area would follow a similar pattern to last year - in timing and intensity. And specifically whether the strong La Nina would slow them. So far it isn't.
Whilst there are similarities in what we are seeing over Saudi Arabia with last year - the causes of this years rainstorms appear to be different - and stronger.
Here is a raw PWAT forecast for the area. And it is showing levels of PWAT over the Sahel seen last year far later in the year than this.
In #extremeweather terms, initial indications are that 2022 will be a significant step up from 2021.

/ENDS

@Threadreaderapp unroll

• • •

Missing some Tweet in this thread? You can try to force a refresh
 

Keep Current with Alastair Thompson

Alastair Thompson Profile picture

Stay in touch and get notified when new unrolls are available from this author!

Read all threads

This Thread may be Removed Anytime!

PDF

Twitter may remove this content at anytime! Save it as PDF for later use!

Try unrolling a thread yourself!

how to unroll video
  1. Follow @ThreadReaderApp to mention us!

  2. From a Twitter thread mention us with a keyword "unroll"
@threadreaderapp unroll

Practice here first or read more on our help page!

More from @althecat

Jul 21
THREAD: Some thoughts on October 7th and the importance of their being global transparency over what we know about what really happened on that terrible day.

1/ This (see screenshots in the first few posts in this thread) is one of the most important pieces of conflict related journalism published in recent years.

It relates to the orders given to soldiers on October 7th to fire on any vehicle seeking to return to the Gaza Strip to prevent the taking of hostages and was published on July 7th, 10 months later in Haaretz.Image
2/ As @IsraeliPM Benjamin Netanyahu prepares to address congress it is vital that the public in the US, Israel and globally is fully aware of what exactly happened on October 7th in Gaza. Image
3/ The account in this story published by Haaretz is at this time still behind a paywall and it has therefore not been read by the very large number of people who ought to have done so. I have not seen very many reports containing the detail of this report elsewhere though I presume there are many.

A copy of the report can be found however on here >> Archive.is
archive.md/zqUntImage
Read 16 tweets
Jul 8
OK so clearly #HurricaneBeryl is not the same as #HurricaneHarvey. But there are some striking similarities in terms of what has made it so much more persistent than either forecast or as modeled.

This thread is going to look at this issue a bit more deeply.
- The overall cloud mass of the #HurricaneBeryl thunderstorm complex proved much more resilient than expected once it came over land. Why?
- Also Like #Harvey Beryl did slow down after making landfall and continued to spin over land. Why?
- I think the answer to both questions relates to the very warm waters of the Gulf of Mexico. Like Harvey back in 2017, Beryl has been fueled by a constant stream of warm wet atmospheric flows of energy off of the Gulf of Mexico.
- This is obvious in part simply from observing the astonishing expansion of the cloud field after #Beryl made landfall early this morning.

A clue to understanding this can be found in looking at the the astonishing growth progression of #HurricaneBeryl's cloud field over landafter Beryl strengthened and formed itself into a Hurricane in the period after making landfall south of Houston.

Over the course of the rest of the morning you can see in these images how much the wind field expanded.
Like Harvey #Beryl also grew and strengthened itself by feeding off of the gulf of mexico, specifically the area between the Texas coastline and what looks like the outer boundary of the convection field which expanded extremely strongly to the north.

The only source for all this additional atmospheric moisture can be the oceanic convection which took place in what is a fairly clearly bounded 136,000 km2 area of ocean which as you can see in this animation is very closely bound to the rest of the circulation.

This is a much much larger area than the area of active rainfall which settled over the city and metropolis of Houston for the morning and which is finally starting to move off to the north now.
This version of the graphic shows the comparative sizes of the area of water which is responsible for the astonitising growth of post landfall #HurricaneBeryl - and the area of the storm that remained over the ocean and which is almost certainly responsible for both why this storm was so persistent and why it (like Harvey) slowed down after coming ashore.
Read 4 tweets
Jul 8
#HurricaneBerylis not expected to give up lightly as it moves onshore and turns north eastward over Texas and then heads north east across the great planes towards the great lakes.

Typically we expect hurricanes to weaken rapidly over land - especially wind wise. But #Berylis not forecast to behave as normal - probably because like Harvey, its tail over the Gulf is keeping it fueled. - the currently forecast pattern from Fox News's exclusive model shown in these images was present in some of the simulations of Beryl after it crossed the Yucutan a couple of days ago.

To my mind questions ought to be asked about the accuracy of the forecasting for this storm, as - like the last super destructive Texas Hurricane, Harvey in 2017 [] Beryl is proving to be a LOT more destructive in its impacts than initially forecast.en.wikipedia.org/wiki/Hurricane…Image
Image
Image
Image
The final image in this sequence of screenshots of Fox Weather Graphics is worth drawing attention to as it shows how much broader the impacts of this hurricane are expected to be as it moves across the great planes roughly speaking heading up the Mississippi river, and continuing to dump potential flooding rain as it goes.Image
This image shows the forecast expected severe weather threat from the remnants of #HurricaneBeryl in Arkansas and Missouri up as far as Saint Louis. Image
Read 6 tweets
Jul 8
ALERT: High Target News Environment in play - numerous consequential news events with global implications.

1. British elections - (Thursday July 4th-Friday July 5th): Delivering an unprecedented landslide win to the left's @UKLabour Party + strong showings for the Liberals and Greens . The UK Chancellor @RachelReevesMP will shortly set out her economic policy in a speech.

2. French elections (Sunday July 7th) deliver a remarkable 2nd big win for the left in politics in France - dashing the hopes of Marine le Pen's hard right wing "Rassemblement National" of first parliamentary victory

3. Overnight (7th-8th July): an unprecedented huge Hurricane , #Hurricane Beryl - makes landfall in Houston as a Category 1 Hurricane, its main threat to the epicenter of the global fossil fuel industry will be flooding. It is still night in Houston at present.
You can watch the new UK Chancellor's speech live here now >> youtube.com/live/oJUvTVdTM…
English language coverage of the French Election from @France24_en can be watched here >>
Read 5 tweets
Jul 1
Hmmmmmm…. Why is the audio of the @youtube version of the UNSG office daily briefing for 1st July missing sound from 5:24 to 6:07?

Afghanistan, Lebanon, Myanmar & other topics - Daily Press Briefing (1 J... via @YouTube

Image
Image
The content of this portion is available as it is simply a quote from written remarks of UNSG @antonioguterres made to a meeting in Austria. But the missing YouTube audio is unprecedented in my experience and hard to explain.
Video from the un platform is here. webtv.un.org/en/asset/k12/k…
Read 10 tweets
Jun 23
Another day. Another Israeli
war crime.

Intense bombing by Israeli forces on Gaza continues and kills at least 3... via @YouTube
This report also addresses the widening rift between Israeli PM Netanyahu and the U.S. Government. True to form Netanyahu is showing no sign of backing down. But this tweet showing former Defence Minister Yoav Gallant leaving on a U.S. flight for the U.S. speaks volumes in this very intense moment.

Amidst continued bombing of Rafah, Israeli forces are resuming strikes i... via @YouTube
And here from two days ago more Margaret Brennan context on the rupture in relations between the @WhiteHouse and @IsraeliPM

Israel has not come close to destroying Hamas, U.S. official says via @YouTube
Read 7 tweets

Did Thread Reader help you today?

Support us! We are indie developers!


This site is made by just two indie developers on a laptop doing marketing, support and development! Read more about the story.

Become a Premium Member ($3/month or $30/year) and get exclusive features!

Become Premium

Don't want to be a Premium member but still want to support us?

Make a small donation by buying us coffee ($5) or help with server cost ($10)

Donate via Paypal

Or Donate anonymously using crypto!

Ethereum

0xfe58350B80634f60Fa6Dc149a72b4DFbc17D341E copy

Bitcoin

3ATGMxNzCUFzxpMCHL5sWSt4DVtS8UqXpi copy

Thank you for your support!

Follow Us!

:(