Trevor Bedford Profile picture
Apr 18 19 tweets 7 min read
We're now starting to see the evolution of new potentially impactful sublineages of Omicron with particular focus on mutations at spike residue 452. Here, I'd like to highlight lineages B.2.12.1 in New York, as well as BA.4 and BA.5 in South Africa. 1/17
Stepping back, Omicron emerged as three distinct lineages BA.1, BA.2 and BA.3 and despite the head start of BA.1, we've seen BA.2 overtake BA.1 across the world over the course of January to April. 2/17 Image
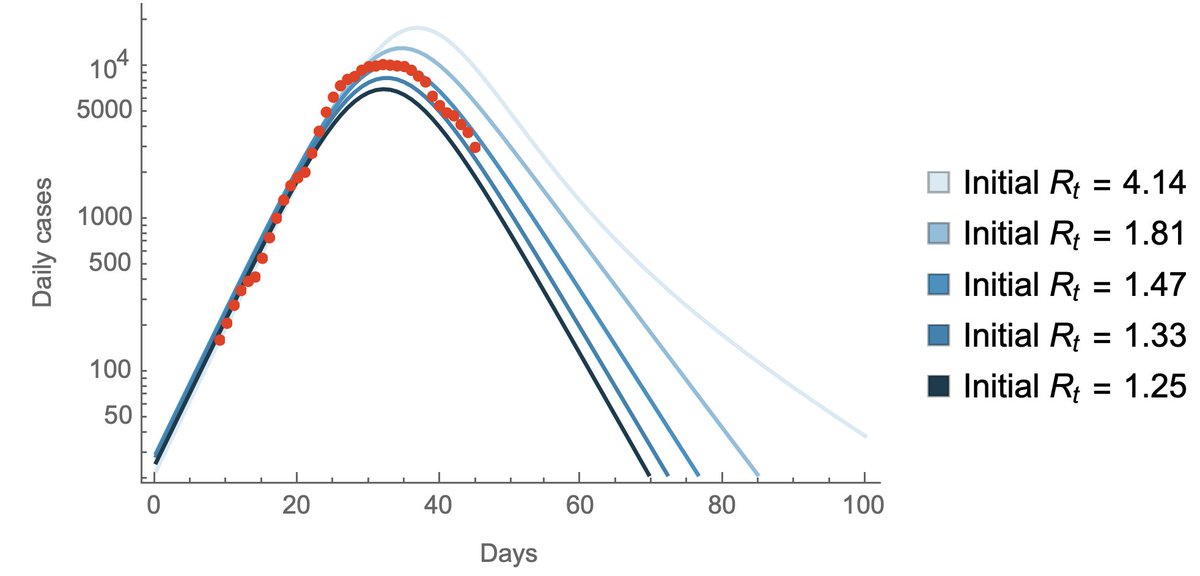
Variant "fitness" will depend on intrinsic transmissibility and escape from existing population immunity. The first tranche of variants (Alpha, Delta, etc...) largely spread due to increased intrinsic transmissibility, while Omicron spread primarily due to immune escape. 3/17
BA.2's advantage over BA.1 appears to be due to intrinsic transmissibility. The antigenically important S1 region of spike is highly similar between BA.1 and BA.2 and we observe similar vaccine effectiveness between BA.1 and BA.2 (figure from @UKHSA gov.uk/government/pub…). 4/17 Image
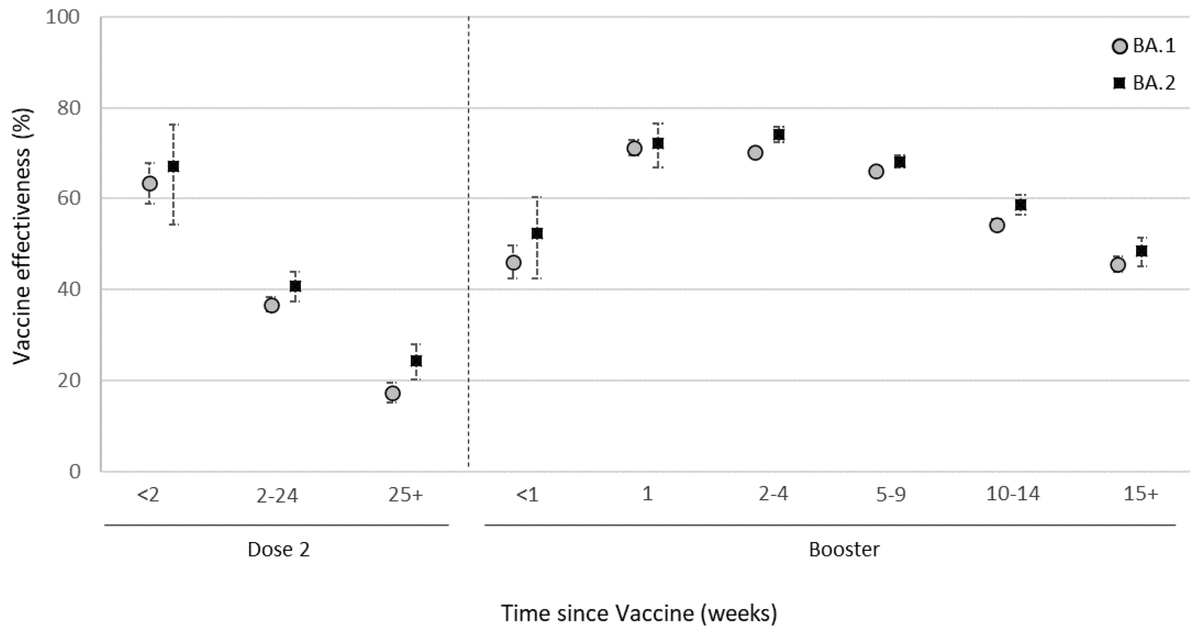
With BA.2's global dominance we expect further evolution to occur on top of BA.2. @PangoNetwork now classifies 21 sublineages of BA.2. However, most of these sublineages are characterized by mutations thought to have little impact (figure from nextstrain.org/nextclade/sars…). 5/17 Image
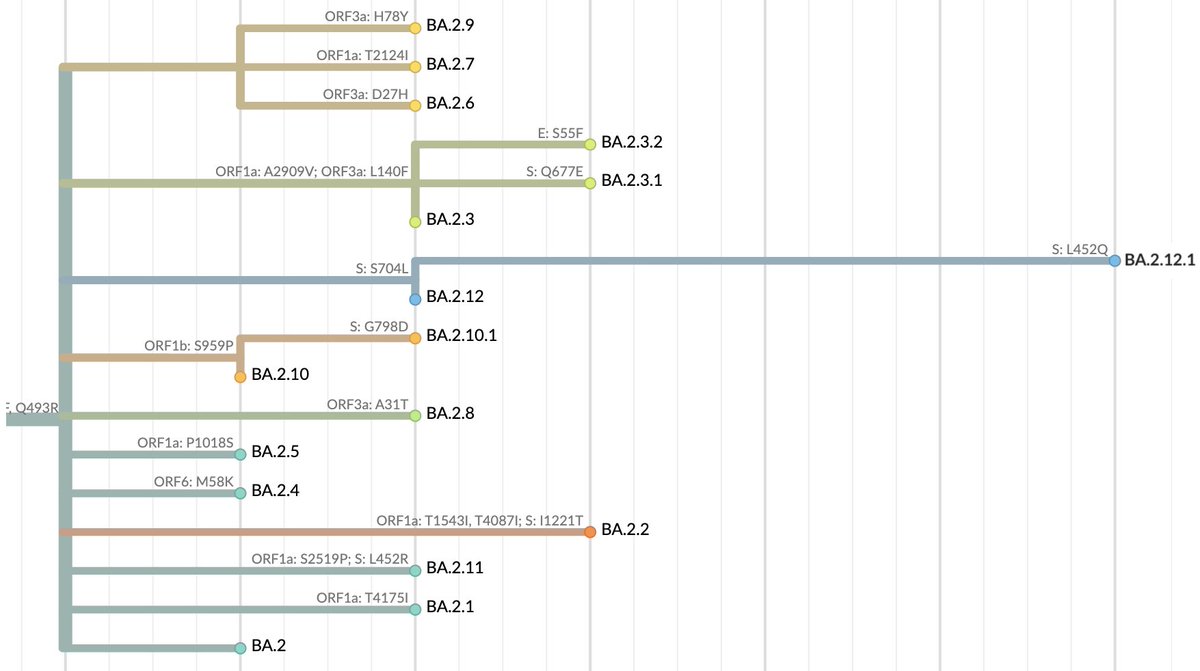
Here, the one to watch just based on mutations is B.2.12.1 which has spike mutations S704L and L452Q on top of BA.2 background. Previously, L452R appeared to have an important role in promoting the spread of Delta and also showed up in Epsilon and Lambda. 6/17
The primary geographic focus for B.2.12.1 is New York state, which was up to ~18% frequency as of April 1 from ~1% at the beginning of March. Similarly, Massachusetts has increased to 7% frequency as of April 1 from below 1% frequency at the beginning of March. 7/17 Image
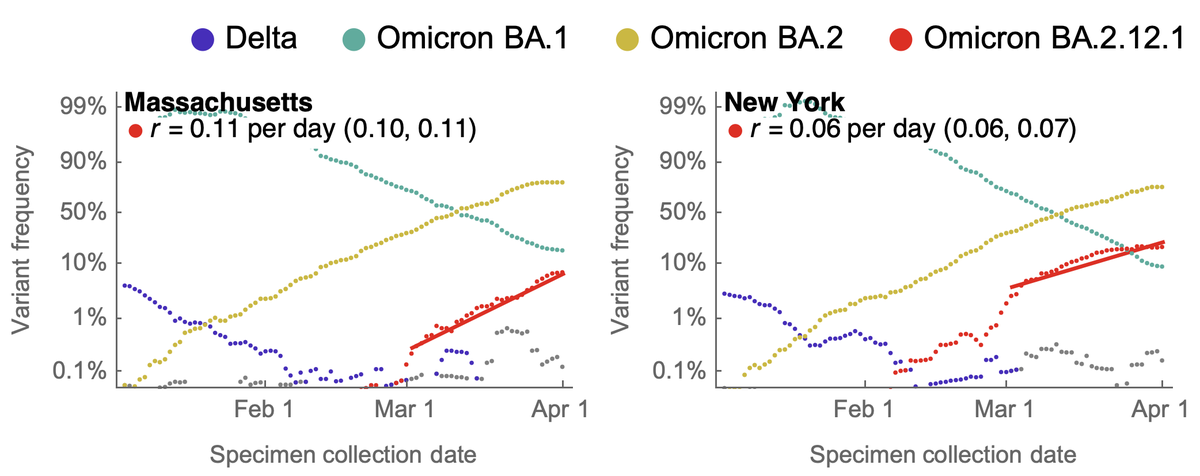
We observe a logistic growth rate of 0.06 per day in NY and 0.11 per day in MA. This is similar in magnitude to the observed advantage of BA.2 over BA.1. 8/17
We have a similar, though somewhat more complex, situation in South Africa with lineages BA.4 and BA.5 which share spike mutations L452R, F486V and reversion Q493R. Figure from @CorneliusRoemer . 9/17 Image
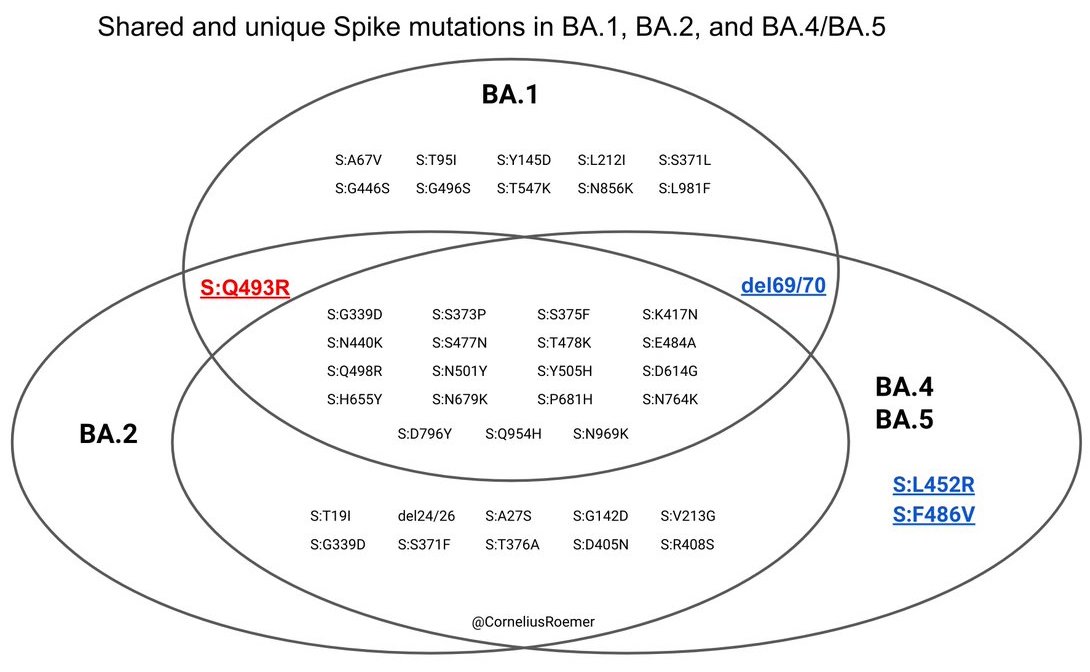
It's not entirely clear to me whether BA.4 and BA.5 are sister lineages to BA.2 or sublineages of BA.2, but this distinction shouldn't matter for assessment of impact on viral circulation. 10/17
The primary geographic focus for BA.4 is Gauteng, where as of April 1 it was at ~60% frequency, and the primary focus for BA.5 is KwaZulu-Natal, where as of April 1 it was at ~55% frequency. 11/17 Image
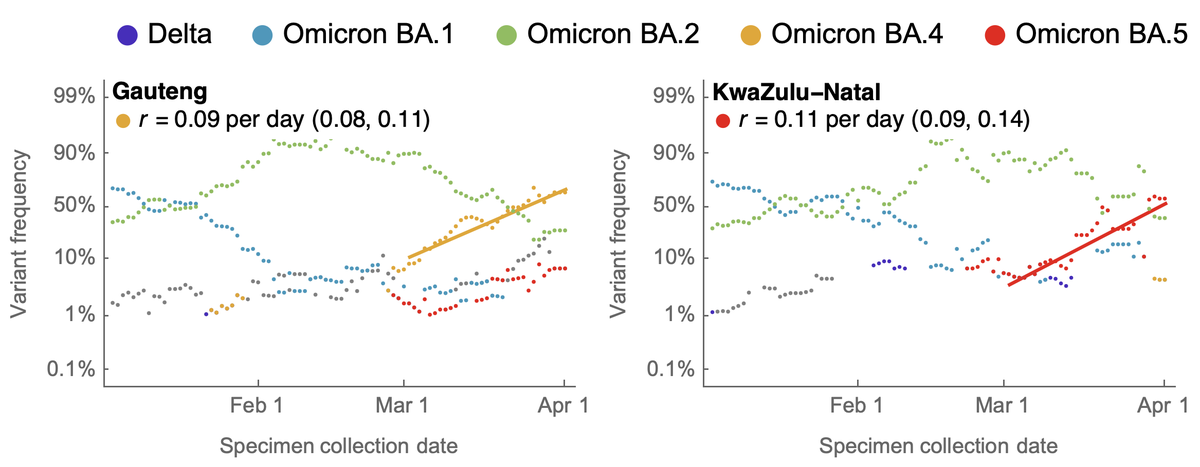
We observe logistic growth rates of BA.4 in Gauteng of 0.09 per day and of BA.5 in KwaZulu-Natal of 0.11 per day. Again, this is similar in magnitude to the observed advantage of BA.2 over BA.1. 12/17
Based on serological experiments it seems quite likely that 486V would confer some additional immune escape relative to BA.2 (figure from @jbloom_lab ). However, 452R/Q is not obviously a key antigenic mutation. 13/17 Image
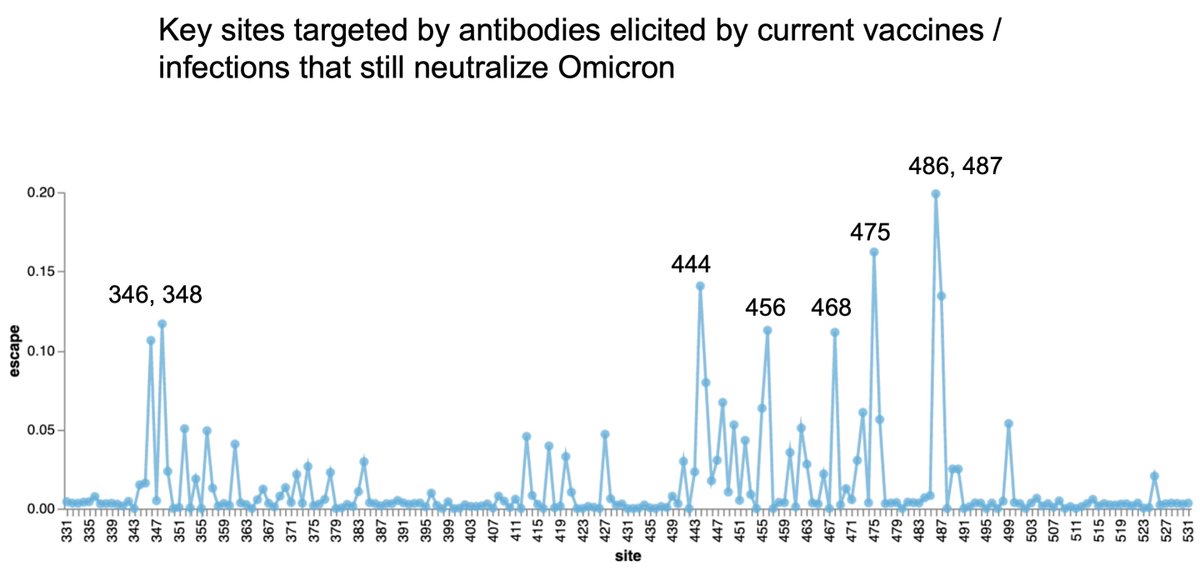
The hypothesis is then that 452R/Q is conferring some additional intrinsic transmission advantage. Distinguishing these scenarios is challenging however and largely relies on assessing neutralization titer in assays with 452R/Q viruses and recent human sera. 14/17
Looking forward, I expect these 452R/Q sublineages to continue to expand. As they do so, they may acquire additional mutations with the "winning" sublineage the one that accumulates the best constellation of mutations. 15/17
However, it's also possible for some other mutational constellation to arise (on top of BA.2 or otherwise) and overtake these new 452R/Q lineages. 16/17
This sort of accumulation of mutations that drive further host adaptation and antigenic drift is my general expectation for evolution in the coming months. It's possible we may have additional "Omicron-like" events, but my baseline is this steady "flu-like" scenario. 17/17
Follow up #1: And of course, I made a consistent typo in the thread where I write "B.2.12.1" when instead I should have written "BA.2.12.1". The figures are correctly annotated at least.
Follow up #2: The above was remiss in not acknowledging the incredible work of @Tuliodna, @ceri_news, @nicd_sa, @nhls_sa in generating and sharing sequence data on BA.4 and BA.5 in South Africa. They've been absolutely essential throughout the pandemic.

• • •

Missing some Tweet in this thread? You can try to force a refresh
 

Keep Current with Trevor Bedford

Trevor Bedford Profile picture

Stay in touch and get notified when new unrolls are available from this author!

Read all threads

This Thread may be Removed Anytime!

PDF

Twitter may remove this content at anytime! Save it as PDF for later use!

Try unrolling a thread yourself!

how to unroll video
  1. Follow @ThreadReaderApp to mention us!

  2. From a Twitter thread mention us with a keyword "unroll"
@threadreaderapp unroll

Practice here first or read more on our help page!

More from @trvrb

Apr 7
Today, I presented to @US_FDA VRBPAC with an overview of SARS-CoV-2 evolution up to this point and a brief perspective for what to expect going forward. Slides are here: bedford.io/talks/sars-cov… and my slot in the full recording is viewable here: . 1/13
My main point was really how fast evolution has been proceeding. We see that SARS-CoV-2 variants have (1) displaced existing genetic diversity and (2) accumulated amino acid changes in the relevant domain much faster than seen in the fastest seasonal flu subtype H3N2. 2/13
It seems fully reasonable to expect continued rapid evolution as the virus seeks to escape from widespread population immunity acquired through infection and vaccination. 3/13
Read 13 tweets
Jan 28
Omicron viruses can be divided into two major groups, referred to as PANGO lineages BA.1 and BA.2 or @nextstrain clades 21K and 21L. The vast majority of globally sequenced Omicron have been 21K (~630k) compared a small minority of 21L (~18k), but 21L is gaining ground. 1/15
Omicron clades 21K and 21L differ at ~40 amino acid sites, which is substantial in the context of SARS-CoV-2 evolution. 2/15
For comparison Alpha, Beta and Gamma are each about as divergent from each other in terms of amino acid changes across the genome as Omicron 21K and 21L are from each other. Figure from @nextstrain (nextstrain.org/ncov/gisaid/gl…). 3/15
Read 15 tweets
Jan 20
Case counts for the US appear to have peaked at a 7-day average of 806k on Jan 14. Omicron grew from approximately 35k daily cases on Dec 14 to ~800k daily cases in ~4 weeks. 1/9
Looking at cases per 100k population per day across states, downturns are clear in NY, NJ, MA, FL, etc..., but many states are not yet at peak case loads. 2/9
If we partition @CDCgov cases between Delta and Omicron using @GISAID sequence data following approach by @marlinfiggins (bedford.io/papers/figgins…) we can see clear Omicron epidemics. 3/9
Read 9 tweets
Jan 10
With Omicron, case counts in the US and many other countries have skyrocketed. The US 7-day average is now ~680k cases per day, or 0.2% of the population recorded as confirmed cases each day. 1/15
However, a large fraction of infections, symptomatic and otherwise, don't end up reported as cases due to lack of testing (either the individual doesn't seek testing or testing is desired but not readily found). 2/15
Historically, I have assumed that around 30% of infections in the US are reported as cases. This number was derived from seroprevalence and modeling estimates from sites like (no longer updated) covid19-projections.com. 3/15
Read 15 tweets
Jan 5
The impact of Omicron on case counts in the US is now abundantly obvious with 885k reported cases yesterday alone. Figure using @CDCgov data and showing daily reported cases with 7-day smoothing on log scale. 1/12
We can partition state-level cases between Delta and Omicron using sequence data from @GISAID. This is made possible by 1.6 million genomes from the US from viruses sampled since Oct 15. This remarkable dataset is thanks to a large number of labs throughout the country. 2/12
Genomic data will necessarily be lagged by about 10 days, but we can use modeling framework from @marlinfiggins to project forward variant-specific frequencies and epidemic growth rates to the present. 3/12
Read 13 tweets
Dec 23, 2021
Rapid growth and early crest compared to simple Rt estimate can perhaps be explained by a shortened generation interval. We observe a 2-3 day doubling, but calculating the number of secondary infections requires a generation interval assumption. 8/17
The Norway Christmas party case study by Brandal et al (eurosurveillance.org/content/10.280…) shows a clear 3-day incubation period vs ~4.3 days for Delta and ~5.0 days for other variants (thelancet.com/journals/lanep…). 9/17
Similar values of initial epidemic growth rate r can have different values of Rt based on generation interval and lower Rt results in waves that break with fewer individual's infected. 10/17
Read 14 tweets

Did Thread Reader help you today?

Support us! We are indie developers!


This site is made by just two indie developers on a laptop doing marketing, support and development! Read more about the story.

Become a Premium Member ($3/month or $30/year) and get exclusive features!

Become Premium

Don't want to be a Premium member but still want to support us?

Make a small donation by buying us coffee ($5) or help with server cost ($10)

Donate via Paypal

Or Donate anonymously using crypto!

Ethereum

0xfe58350B80634f60Fa6Dc149a72b4DFbc17D341E copy

Bitcoin

3ATGMxNzCUFzxpMCHL5sWSt4DVtS8UqXpi copy

Thank you for your support!

Follow Us on Twitter!

:(