1/#Maytronics MTRN.IT
During my $POOL Q1 review I came across a terrific company, #Maytronics, the leading manufacturer of pool cleaning robots. MTRN.IT has 50% market share, 25% ROIC, 20% margins, and grew sales 10x over ‘04-‘21. Some key notes...
During my $POOL Q1 review I came across a terrific company, #Maytronics, the leading manufacturer of pool cleaning robots. MTRN.IT has 50% market share, 25% ROIC, 20% margins, and grew sales 10x over ‘04-‘21. Some key notes...

2/Intro
Headquartered in Israel, #Maytronics manufacturers a lineup of pool cleaning robots under the Dolphin brand name. In '21, generated USD $437mln in revenue (1.4bln ILS) and $110mln in EBITDA (334mln ILS) (24% margin). Has a USD $2bln mkt cap with $62mln in net debt (0.6x)
Headquartered in Israel, #Maytronics manufacturers a lineup of pool cleaning robots under the Dolphin brand name. In '21, generated USD $437mln in revenue (1.4bln ILS) and $110mln in EBITDA (334mln ILS) (24% margin). Has a USD $2bln mkt cap with $62mln in net debt (0.6x)

3/Products
MTRN.IT makes an array of pool cleaning robots for private/public pools. Private pool robot ASP’s range $600-$1700. Price leader, generally gets premium pricing due to strong brand reputation, superior product and a superior distribution/service network
MTRN.IT makes an array of pool cleaning robots for private/public pools. Private pool robot ASP’s range $600-$1700. Price leader, generally gets premium pricing due to strong brand reputation, superior product and a superior distribution/service network

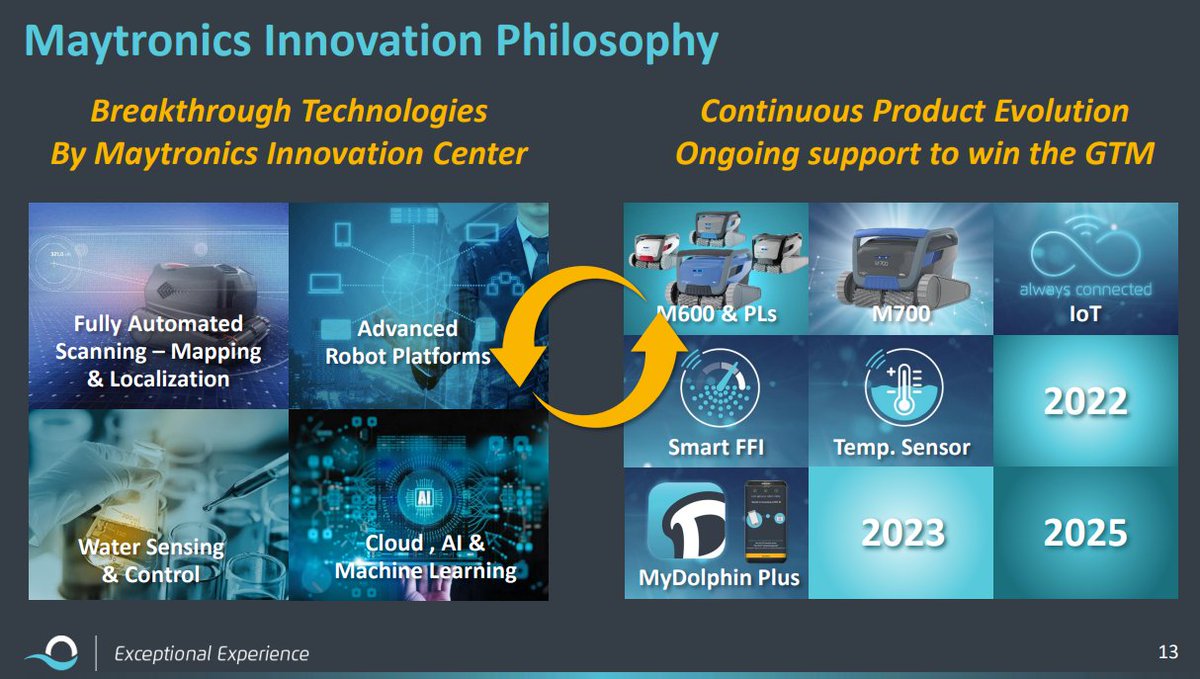
4/Product Innovation
#Maytronics is a product innovation/vitality story. Constant cadence of new products released with better and better features drives share gains, improves brand strength and sustains MTRN.IT lead vs. less R&D competent competitors
#Maytronics is a product innovation/vitality story. Constant cadence of new products released with better and better features drives share gains, improves brand strength and sustains MTRN.IT lead vs. less R&D competent competitors

5/Competition
MTRN.IT has 10 main peer manufacturers of robots, only 3 have material mkt share – Fluidra, BWT, and Hayward. These firms are super manufacturers of a wide range of pool products with pool robots not being a key focus and very small business for them
MTRN.IT has 10 main peer manufacturers of robots, only 3 have material mkt share – Fluidra, BWT, and Hayward. These firms are super manufacturers of a wide range of pool products with pool robots not being a key focus and very small business for them

6/Low Robot Penetration
#Maytronics estimates only 16% of the 26mln global pools are cleaned by a robot with the rest served by suction/pressure and manual cleaning. While MTRN.IT dominates with 50% robotic share it has just 8% share of the overall cleaning space
#Maytronics estimates only 16% of the 26mln global pools are cleaned by a robot with the rest served by suction/pressure and manual cleaning. While MTRN.IT dominates with 50% robotic share it has just 8% share of the overall cleaning space

7/Cleaning
Pools must be cleaned constantly, usually 1-2/week but often more depending on #pool/area. Cleanliness impacts water quality, amount of chemicals needed and the useful life of pool equipment like filters, pumps, coatings, tile, and veneer. $MTRN.IT
Pools must be cleaned constantly, usually 1-2/week but often more depending on #pool/area. Cleanliness impacts water quality, amount of chemicals needed and the useful life of pool equipment like filters, pumps, coatings, tile, and veneer. $MTRN.IT

8/Traditional Methods
Traditional methods (suction/pressure) are labor intensive, requiring #pool owners or contractors to spend many hours each season cleaning. Quality of cleaning also highly dependent on the operator being thorough and comprehensive with equipment. $MTRN.IT
Traditional methods (suction/pressure) are labor intensive, requiring #pool owners or contractors to spend many hours each season cleaning. Quality of cleaning also highly dependent on the operator being thorough and comprehensive with equipment. $MTRN.IT

9/Value Prop [1]
Robots are more expensive upfront, but gains in tech have made them superior vs. other methods. Have exclusive ability to scan surfaces and scrub #pool veneer w/precision, removing bacteria, algae, etc. On board filters also continuously clean pool water as well
Robots are more expensive upfront, but gains in tech have made them superior vs. other methods. Have exclusive ability to scan surfaces and scrub #pool veneer w/precision, removing bacteria, algae, etc. On board filters also continuously clean pool water as well

10/ Value Prop [2]
Robot value prop to a pool owner appears high. Reduces/eliminates the need for manual owner/contractor cleaning by running themselves, saving owners time/money. Better cleaning also reduces the volume of chemicals and improves life of #pool equipment/surfaces
Robot value prop to a pool owner appears high. Reduces/eliminates the need for manual owner/contractor cleaning by running themselves, saving owners time/money. Better cleaning also reduces the volume of chemicals and improves life of #pool equipment/surfaces

11/Value Prop [3]
#Maytronics has noted use of robots can save pool owners “hundreds per year” and improve the useful life of the pools surfaces/equipment. Noted a pool with a robot needs to change its filter at 1/3 the rate of a non-robotically cleaned pool.
#Maytronics has noted use of robots can save pool owners “hundreds per year” and improve the useful life of the pools surfaces/equipment. Noted a pool with a robot needs to change its filter at 1/3 the rate of a non-robotically cleaned pool.
12/Barriers to Entry [1]
Manufacturing pool cleaning robots at #Maytronics level requires a high degree of specific technical experience. Product is also sold through distributors (i.e., $POOL) who also provide a service network to repair robots.
Manufacturing pool cleaning robots at #Maytronics level requires a high degree of specific technical experience. Product is also sold through distributors (i.e., $POOL) who also provide a service network to repair robots.

13/Barriers to Entry [2]
High distributor loyalty, a fragmented distributor base and costs/time to spin up a service network make it difficult for new entrants to create a channel to market. e-commerce is a path, but still lack a service network and product quality is often lower
High distributor loyalty, a fragmented distributor base and costs/time to spin up a service network make it difficult for new entrants to create a channel to market. e-commerce is a path, but still lack a service network and product quality is often lower

14/Comp Advantage
MTRN.IT product innovation competency appears to garner it superior brand reputation in its niche as the best-in-class player. Awarded with high share and premium pricing. Also has a very hard to replicate distribution/service network and IP
MTRN.IT product innovation competency appears to garner it superior brand reputation in its niche as the best-in-class player. Awarded with high share and premium pricing. Also has a very hard to replicate distribution/service network and IP
15/ $POOL partnership
#Maytronics entered a strategic distribution relationship with $POOL in 2012 and is a $POOL VIP vendor, earning multiple “SCP outstanding supplier” awards. $MTRN.IT revenue growth accelerated meaningfully post 2012.
#Maytronics entered a strategic distribution relationship with $POOL in 2012 and is a $POOL VIP vendor, earning multiple “SCP outstanding supplier” awards. $MTRN.IT revenue growth accelerated meaningfully post 2012.

16/Growth
While $MTRN.IT has 50% share, robots are still only used on 16% of pools. Increased penetration could provide multiples of upside even if #Maytronics simply sustains share. $MTRN.IT share has also been increasing over time (’10 32% ’19 48%) and could increase further
While $MTRN.IT has 50% share, robots are still only used on 16% of pools. Increased penetration could provide multiples of upside even if #Maytronics simply sustains share. $MTRN.IT share has also been increasing over time (’10 32% ’19 48%) and could increase further

17/TAM
$MTRN.IT estimates there are 26.2mln global pools. 3.9mln have robotic cleaners (16%). 7.3mln are considered non-addressable leaving 15mln pools addressable for robots. On an ARPU range of $600-$1700 this equates to a $9-26bln gross revenue opportunity.
$MTRN.IT estimates there are 26.2mln global pools. 3.9mln have robotic cleaners (16%). 7.3mln are considered non-addressable leaving 15mln pools addressable for robots. On an ARPU range of $600-$1700 this equates to a $9-26bln gross revenue opportunity.
18/Replacement
$MTRN.IT has noted that the avg replacement cycle of an electric cleaner/robot is 4-5yrs. On an installed base of 3.9mln this provides a 0.8-1mln units/yr. sales opportunity. On an ARPU range of $600-$1700 this equates to a $0.5-$1.7bln annual sales opportunity.
$MTRN.IT has noted that the avg replacement cycle of an electric cleaner/robot is 4-5yrs. On an installed base of 3.9mln this provides a 0.8-1mln units/yr. sales opportunity. On an ARPU range of $600-$1700 this equates to a $0.5-$1.7bln annual sales opportunity.
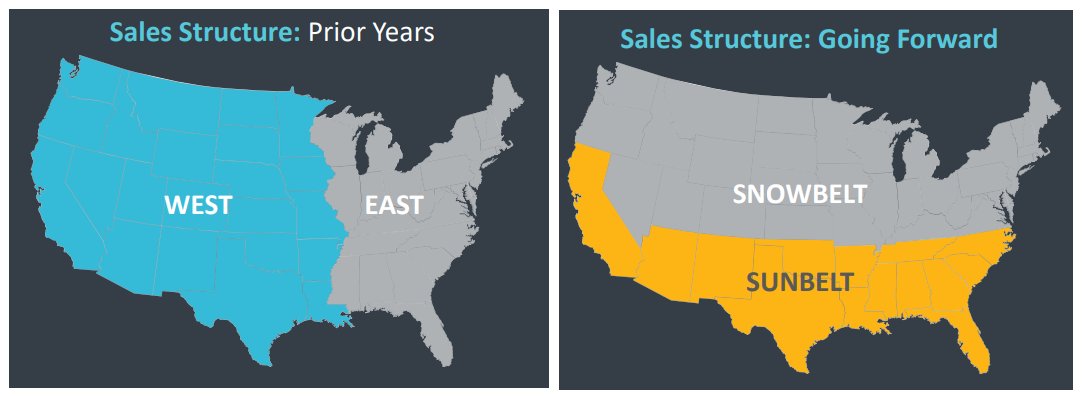
19/US Go To Market
#Maytronics recently restructured its US sales structure from a west/east layout to a snowbelt/sunbelt structure to better align with different dynamics between the two regions. Sunbelt is disproportionally over indexed to manual cleaning.
#Maytronics recently restructured its US sales structure from a west/east layout to a snowbelt/sunbelt structure to better align with different dynamics between the two regions. Sunbelt is disproportionally over indexed to manual cleaning.
20/US Opportunity [1]
#Maytronics estimates that despite the sunbelt having the highest quantity of pools with the longest seasons, it has <1% robotics penetration vs. the snowbelt. Only 18% of MTRN.IT US business revenues are from the sunbelt (snowbelt at 82%)
#Maytronics estimates that despite the sunbelt having the highest quantity of pools with the longest seasons, it has <1% robotics penetration vs. the snowbelt. Only 18% of MTRN.IT US business revenues are from the sunbelt (snowbelt at 82%)

21/US Opportunity [2]
#Maytronics replicating its higher snowbelt penetration in the much larger sunbelt could provide significant upside as there are around ~4.5mln US total in ground pools cleaned with non-robotic methods. The bulk of these not captured are in the sunbelt.
#Maytronics replicating its higher snowbelt penetration in the much larger sunbelt could provide significant upside as there are around ~4.5mln US total in ground pools cleaned with non-robotic methods. The bulk of these not captured are in the sunbelt.

22/ $MTRN.IT Guidance
#Maytronics in their Q4’21 report guided for >17% revenue growth for 2022. LT revenue guidance is for 2.5bln ILS by 2025 (2021 1.4bln ILS), implying a 15%/yr. CAGR. Also targets 17-20% operating margins in 2025 (vs. 2021 19.7%).
#Maytronics in their Q4’21 report guided for >17% revenue growth for 2022. LT revenue guidance is for 2.5bln ILS by 2025 (2021 1.4bln ILS), implying a 15%/yr. CAGR. Also targets 17-20% operating margins in 2025 (vs. 2021 19.7%).
23/Valuation
$MTRN.IT lacks sell side coverage. Using the 17% topline guide for '22 and stable margins $MTRN.IT appears to be trading at around 17x EBITDA and 20x EBIT. Multiples have compressed from Nov/21 peaks of 23x/28x EBITDA/EBIT via a -29% decline in shares from Nov highs
$MTRN.IT lacks sell side coverage. Using the 17% topline guide for '22 and stable margins $MTRN.IT appears to be trading at around 17x EBITDA and 20x EBIT. Multiples have compressed from Nov/21 peaks of 23x/28x EBITDA/EBIT via a -29% decline in shares from Nov highs
24/Conclusion
Overall, the above is a quick and dirty idea generation vetting process I go through on new research candidates. #Maytronics graded out well and will be going on @EquiCompound's list to potentially research in future projects. $MTRN.IT $POOL
Overall, the above is a quick and dirty idea generation vetting process I go through on new research candidates. #Maytronics graded out well and will be going on @EquiCompound's list to potentially research in future projects. $MTRN.IT $POOL

• • •
Missing some Tweet in this thread? You can try to
force a refresh