"NCAP emissions ratings cast doubt on electric cars"
What is going on here?
Let me show you what errors @EuroNCAP and @JOAN_RESEARCH make in their calculations
Before my corrections EVs emit 74% of ICEVs
After correction 34%
I show it step by step so you can judge for yourself
What is going on here?
Let me show you what errors @EuroNCAP and @JOAN_RESEARCH make in their calculations
Before my corrections EVs emit 74% of ICEVs
After correction 34%
I show it step by step so you can judge for yourself
https://twitter.com/AutoExpress/status/1518182973371142146

First off: I research this at the @TUeindhoven & have been debunking EV misinformation for >15 yrs
See my pinned thread
By now almost all researchers agree with me and I esp. love @TheICCT
@RicardoGroupPlc study for EU
@transenv
But @JOAN_RESEARCH and @EuroNCAP need debunking☹️
See my pinned thread
By now almost all researchers agree with me and I esp. love @TheICCT
@RicardoGroupPlc study for EU
@transenv
But @JOAN_RESEARCH and @EuroNCAP need debunking☹️
I wrote a "debunking manual" in @Joule_CP on how to avoid the 6 biggest errors in comparing CO2 emissions of electric vehicles (EVs) and internal combustion vehicles (ICEVs)
I'll use them as the 6 steps in my explanation.
cell.com/joule/pdf/S254…
I'll use them as the 6 steps in my explanation.
cell.com/joule/pdf/S254…

1) Overestimating (battery) production
Here they go wrong
Big time
It's not my 1st rodeo with Joanneum:
avere.org/wp-content/upl…
So forgive me if I say this stinks to high heaven
Last time we spoke/mailed they admitted they used outdated sources (see picture)
Little has changed
Here they go wrong
Big time
It's not my 1st rodeo with Joanneum:
avere.org/wp-content/upl…
So forgive me if I say this stinks to high heaven
Last time we spoke/mailed they admitted they used outdated sources (see picture)
Little has changed

The previous picture came from page 7-9 of a study I did where I also evaluated the Joanneum tool
greenncap.com/wp-content/upl…
What we are researching: how much CO2 does battery production emit in kg/kWh?
They claim 112 kg CO2e/kWh
Modern studies claim 50-75 kg
(see again picture)
greenncap.com/wp-content/upl…
What we are researching: how much CO2 does battery production emit in kg/kWh?
They claim 112 kg CO2e/kWh
Modern studies claim 50-75 kg
(see again picture)
They achieved 112 kg with a neat trick:
1) Assume production is clean in Europe but really dirty in China (their European sponsors love that)
2) Assume almost all production is in China
3) Now batteries are really dirty: mission accomplished!
Page 15
greenncap.com/wp-content/upl…

1) Assume production is clean in Europe but really dirty in China (their European sponsors love that)
2) Assume almost all production is in China
3) Now batteries are really dirty: mission accomplished!
Page 15
greenncap.com/wp-content/upl…


They also assume the rest of the EV is dirtier to make than the ICEV
Why??
I will compare the @VW Golf and ID.3 to illustrate
(Do you agree @Herbert_Diess ?)
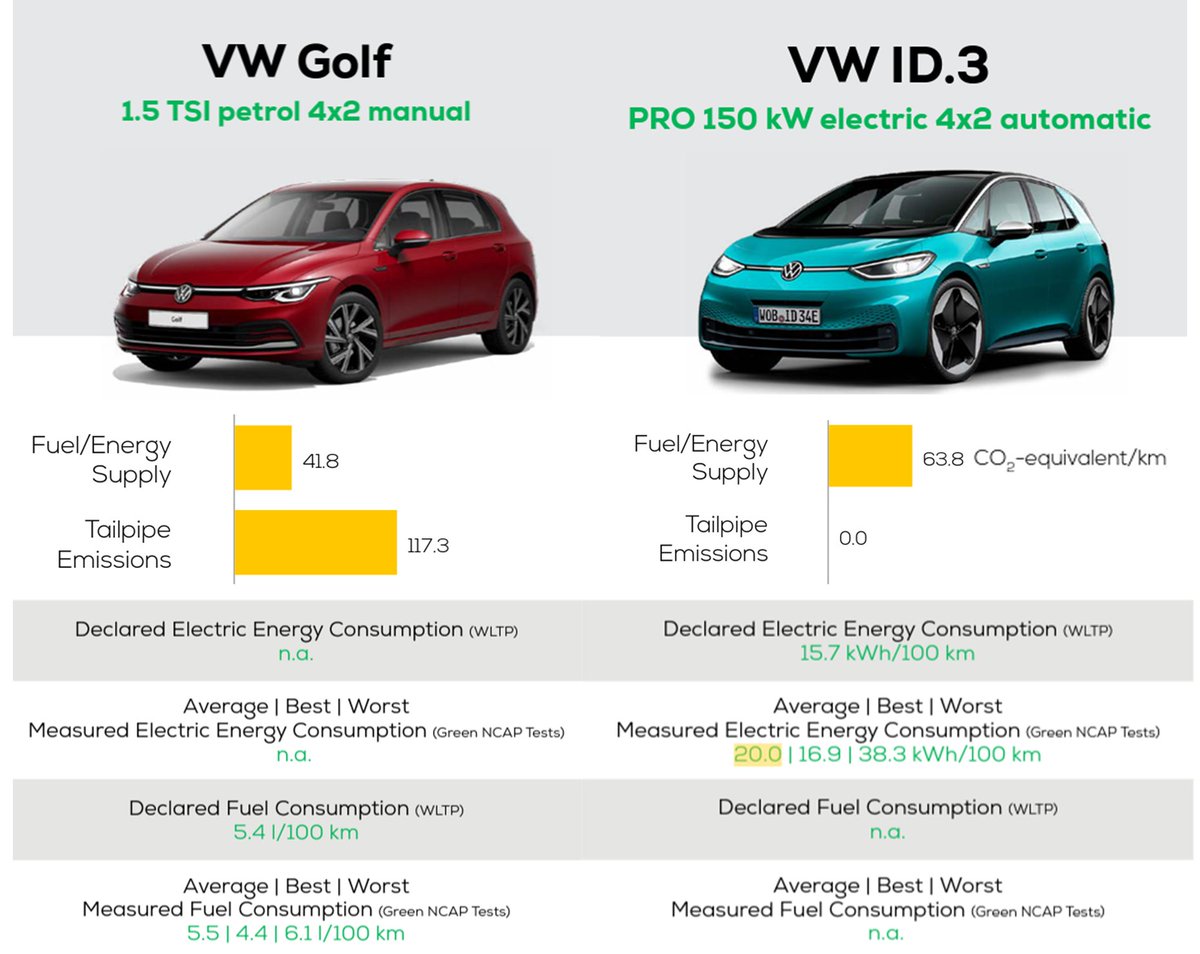
According to Joanneum & NCAP, producing them emits the following:
Golf 35.5 g/km
ID.3 56.2+28.8=85 g/km
(see pic)
Why??
I will compare the @VW Golf and ID.3 to illustrate
(Do you agree @Herbert_Diess ?)
According to Joanneum & NCAP, producing them emits the following:
Golf 35.5 g/km
ID.3 56.2+28.8=85 g/km
(see pic)

To get production emissions you must multiply by km
They assume 240k km
So:
Golf 35.5*240=8500 kg
ID.3 85*240=20400 kg
Wow! That's an extreme difference!
Fortunately @VW have made this specific comparison themselves
The VW comparison implies Joanneum is full of crap
They assume 240k km
So:
Golf 35.5*240=8500 kg
ID.3 85*240=20400 kg
Wow! That's an extreme difference!
Fortunately @VW have made this specific comparison themselves
The VW comparison implies Joanneum is full of crap
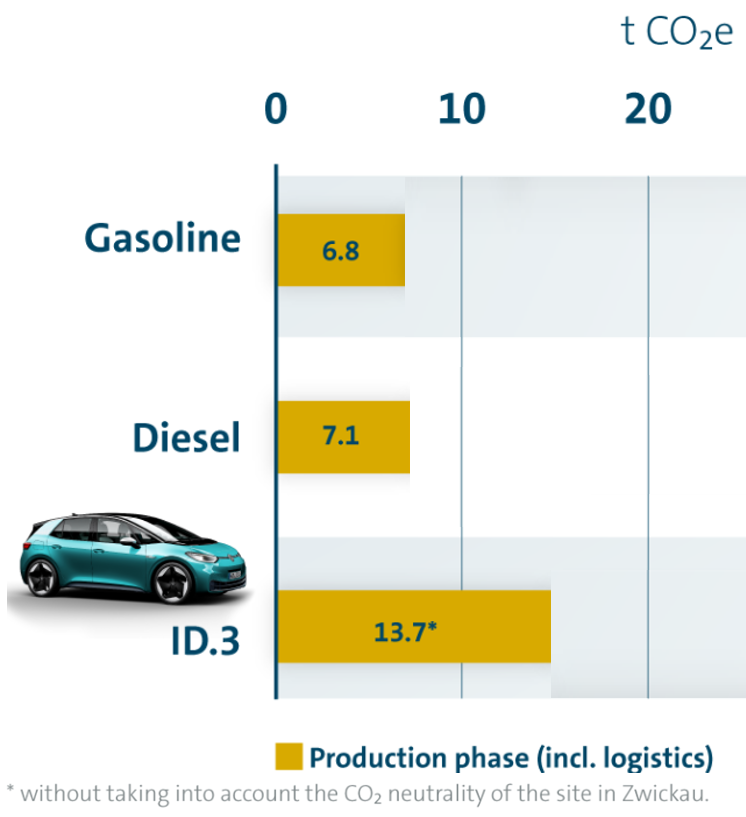
Here is @VW, comparing their Golf 8 gasoline and ID.3
The Golf 8 stays almost the same but the ID.3 production emits *much* less than Joanneum claims:
ID.3 13700 kg instead of 20400 kg: 33% less
(On top of that the ID.3 factory buys green energy etc.)
volkswagenag.com/en/news/storie…
The Golf 8 stays almost the same but the ID.3 production emits *much* less than Joanneum claims:
ID.3 13700 kg instead of 20400 kg: 33% less
(On top of that the ID.3 factory buys green energy etc.)
volkswagenag.com/en/news/storie…

2) Underestimating battery lifetime
This is 1 of the things they get right!
When I started people assumed car batteries could only last 150k km but NCAP and Joanneum suppose 240k km
(I think it's 255k km but let's not nitpick)
greenncap.com/wp-content/upl…
This is 1 of the things they get right!
When I started people assumed car batteries could only last 150k km but NCAP and Joanneum suppose 240k km
(I think it's 255k km but let's not nitpick)
greenncap.com/wp-content/upl…

3) Assume unchanging electricity mix over the lifetime
We are making a life cycle analysis (LCA)
We estimate all emissions cradle to grave
So we must take the AVERAGE electricity mix over the EVs lifetime
I estimate that's 125 g/kWh incl. grid losses
eea.europa.eu/data-and-maps/…
We are making a life cycle analysis (LCA)
We estimate all emissions cradle to grave
So we must take the AVERAGE electricity mix over the EVs lifetime
I estimate that's 125 g/kWh incl. grid losses
eea.europa.eu/data-and-maps/…

@JOAN_RESEARCH assumes 319 g/kWh!
(63.8 g/km divided by 0.20 kWh/km)
More than twice as much!
I think they took an old EU value for CO2 emissions and forgot to update it over the lifetime of the vehicle
It's not what their method suggests but can't explain it otherwise
(63.8 g/km divided by 0.20 kWh/km)
More than twice as much!
I think they took an old EU value for CO2 emissions and forgot to update it over the lifetime of the vehicle
It's not what their method suggests but can't explain it otherwise

4) Unrealistic tests for energy use
Fuel measurements in the EU are a mess where carmakers are invited to cheat
See pics for details but the gist is that official measurements are still ~15% too low on average and 2-4x too low for PHEVs
(PHEVs are the next #dieselgate)


Fuel measurements in the EU are a mess where carmakers are invited to cheat
See pics for details but the gist is that official measurements are still ~15% too low on average and 2-4x too low for PHEVs
(PHEVs are the next #dieselgate)


Of course @EuroNCAP and @JOAN_RESEARCH go along with the cheating
So don't believe the 117.3 g tailpipe emissions:
it's much too low
(Curiously enough they do get a higher realistic value for the EV but not for the ICEV: do you see a pattern?)
So don't believe the 117.3 g tailpipe emissions:
it's much too low
(Curiously enough they do get a higher realistic value for the EV but not for the ICEV: do you see a pattern?)

The US and Spritmonitor know how to do realistic measurements (see pics/links)
EPA: 7.35 l/100 km
Spritmonitor: 7.43 l/100 km
Let's go with 7.4 l/100 km
That's 37% more than what @JOAN_RESEARCH and @EuroNCAP assume!
fueleconomy.gov/feg/Find.do?ac…
spritmonitor.de/de/uebersicht/…

EPA: 7.35 l/100 km
Spritmonitor: 7.43 l/100 km
Let's go with 7.4 l/100 km
That's 37% more than what @JOAN_RESEARCH and @EuroNCAP assume!
fueleconomy.gov/feg/Find.do?ac…
spritmonitor.de/de/uebersicht/…


But there's more! Now they continue to lower ICEV emissions by adding zero carbon biofuels
See pic: wheat and rapeseed to increase hunger and palm oil to destroy forests
All big CO2 emitters but for @JOAN_RESEARCH and @EuroNCAP they bring down ICEV emissions further
Yay!
See pic: wheat and rapeseed to increase hunger and palm oil to destroy forests
All big CO2 emitters but for @JOAN_RESEARCH and @EuroNCAP they bring down ICEV emissions further
Yay!

5) Ignore fuel production
This one they get right
I would include a bit more for diesel (other calculation in their tool) but for gasoline 30% is about right:

This one they get right
I would include a bit more for diesel (other calculation in their tool) but for gasoline 30% is about right:
https://twitter.com/AukeHoekstra/status/1229108129301921792

6) Take the future system into account
This is not really an error but it's kind of important:
if we keep adding renewables - both for EV production and EV driving - we can get very close to zero CO2 emissions with EVs
For ICE we might be able to shave off ~20% but that's it
This is not really an error but it's kind of important:
if we keep adding renewables - both for EV production and EV driving - we can get very close to zero CO2 emissions with EVs
For ICE we might be able to shave off ~20% but that's it
Summing up my improvements:
1) @VW's own LCA for ICE and EV production
3) 125 g/kWh instead of 319 g/kWh for electricity
4) Golf 7.4 l/100km and no biofuels
End result:
the gasoline car emits ~3x more than the EV
I hope @EuroNCAP and @JOAN_RESEARCH will react here and rectify
1) @VW's own LCA for ICE and EV production
3) 125 g/kWh instead of 319 g/kWh for electricity
4) Golf 7.4 l/100km and no biofuels
End result:
the gasoline car emits ~3x more than the EV
I hope @EuroNCAP and @JOAN_RESEARCH will react here and rectify

P.S. I hope I haven't made any errors (it's Sunday night 1 AM for me but busy day tomorrow) and I hope I don't come across as arrogant, but I've been doing this for 15 years now and it gets irritating to combat the endless fossil bias against EVs
P.P.S. I hate that the tool mixes lobby and truth
This causes doublespeak
WLTP is result of lobbying politicians
Not a scientific CO2 measurement
Official EU biofuel emissions?
Also lobby result
Ignores indirect land use change etc
Lobby is unavoidable but we need truth too!
This causes doublespeak
WLTP is result of lobbying politicians
Not a scientific CO2 measurement
Official EU biofuel emissions?
Also lobby result
Ignores indirect land use change etc
Lobby is unavoidable but we need truth too!
It's worse than I thought: Green NCAP is an automotive lobby club masquerading as objective
Technical lead Aleksandar Damyanov is from the notorious IFA: an evangelist for combustion engines and biofuels who *wants* to create FUD on EVs?
🦇@MLiebreich
autodaily.com.au/green-ncap-cas…
Technical lead Aleksandar Damyanov is from the notorious IFA: an evangelist for combustion engines and biofuels who *wants* to create FUD on EVs?
🦇@MLiebreich
autodaily.com.au/green-ncap-cas…

• • •
Missing some Tweet in this thread? You can try to
force a refresh


