
BRB, calculating the most Macron and most Le Pen protected French wine region.
French wine AOCs are, of course, highly defined. And now #opendata.
https://twitter.com/thomasforth/status/1222958340298493952?s=20&t=lg25sC6maJJ9nZaQwY6kPw
But there's an even better way in. This table (.csv format) has all the protected designation products listed out by commune. And of course we have election results by commune. So it should be pretty easy. data.gouv.fr/fr/datasets/ai…
Stick it together with that in Excel. 

Results are in. Top AOC for Macron is from the commune of Le Clat (11140) a tiny village in Aude département, in Occitanie, in French Catalonia. 43 registered voters. 25 voted for Macron, 1 was a blank vote, 0 for Le Pen.


Oops, got my numbers wrong there. only 31 registered voters. 25 voted for Macron. 1 Blank. 0 for Le Pen. Anyway. The rest is right. But thinking about it, maybe I need to up the quality. Require a top tier AOC. I'll do Le Pen's now and think again.
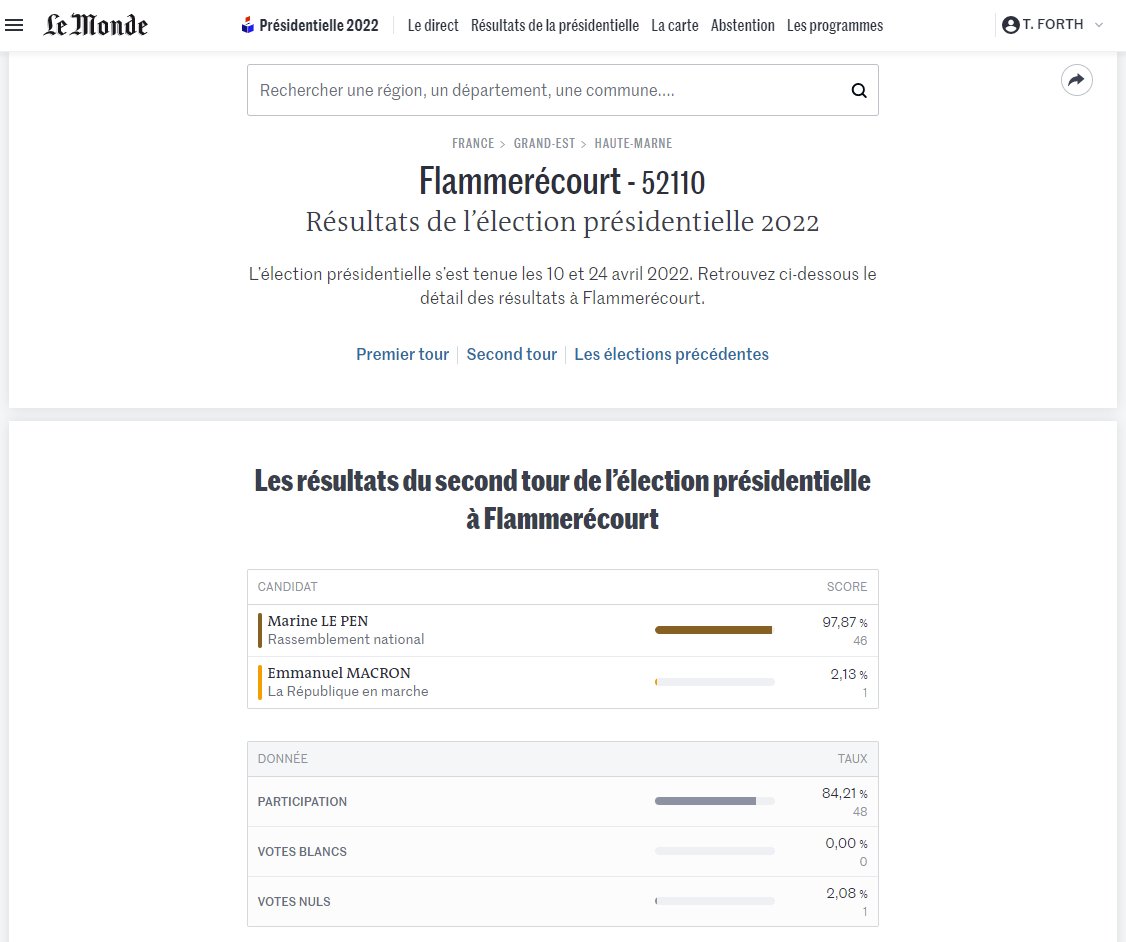
Flammerécourt (52110) in Grand-Est. Quality sparkling wine. 57 registered voters. 48 votes. 1 for Macron (absolute LOL at this village trying to figure out the splitter 🤣). 1 spoiled. 46 for Le Pen.

France is varied eh?


This will need a rethink.
Right. We go again. This time a map. Much less efficient, but built in vibe checks make it less likely I'll mess up, and it should help me refine the question. And this time I'm just looking at AOC wines. But where is Champagne?!?! data.gouv.fr/fr/datasets/de…

Okay. This is another way in. Get each AOC Wine, add up all the votes for its communes. That way the two winners are ones I can actually buy. And who cares about Champagne. I'll figure out why that's missing some other day.
Looking good. Especially for Le Pen. Crikey. Some BIG names in there. Saint-Estèphe, Chablis, Châteauneuf-du-Pape, Pauillac. It's as we'd guess. The Loire for Macron. The Rhône for Le Pen.


I'm going to have to pick ones I can purchase (so not Clairette). So I'll go red. Le Pen's two are gonna be Cotes Du Rhone Villages Plan De Dieu and a Saint Estephe (£££s eek). Macron's --- oh dear,...


I am not to be able to justify that purchase I don't think. Understanding this "President of the Rich" thing now TBH.


Yeah that's not happening Macron.

A lot of prime Burgundy is Macron territory, I didn't realise. I guess it's rich people. The Loire being Macron was expected. I'd have though Bordeaux would be too, but Le Pen is strong in some parts. I think I'd best put this on a map.
People asking after the Crémants. Crémant de Loire is your Macron choice. Crémant de Limoux (the original sparkling wine) is your Le Pen choice.

Well there we are. Yet again with apologies to Champagne, I'll try and fix you another day. I'm using the standard colours, Yellow = Macron, Le Pen = Dark Blue. Here around Angers is dominant Macron wine country. Chablis goes for Le Pen. Big choices.


The lower Rhône is all Le Pen, but Clairette de Die just a bit higher up and off the river a bit is strong Macron. As for Bordeaux, well.


The former bulk wine areas in Languedoc are very Le Pen. Perhaps a desire for protection against cheaper Spanish bulk wine. It's an anti-globalisation sentiment that I can understand. French wine growers want French to drink French wine like in the past. theguardian.com/lifeandstyle/2…


The decline in French alcohol consumption is just astonishing. The average French person drinks less than a quarter as much wine today as they did in the 1960s. And look at that cidre decline.

More data on French boozing since 1960. insee.fr/fr/statistique…

Gone back to 1950 via some PDFs. The decline (in boozing, thus improvement in health and lots of other things) started in the 60s.


1956 infamously when French children stopped being given wine at school. smdh.
https://twitter.com/thomasforth/status/1216386951395323905?s=20&t=Z-rHj_KV7PPD0rLOG33_JQ
Did Le Pen promise to bring school wine back in her manifesto? I have my reservations, but I think it's important for cultures to find common ground at this time so it may be worth investigation?
Well, well, well. UK drinking trends are nothing like French ones. Astonishing. jrf.org.uk/sites/default/…

Armed with my tables and maps from yesterday, I shall now go to @latitude_wine and try and buy their most Macron and their most Le Pen wine.
@latitude_wine Final results were here. -->
https://twitter.com/thomasforth/status/1518707060812271617?s=20&t=36Kdsex4_Gc0obitIqbkhQ
Et voilà.

And look how good the cycle paths are.


It's very important to ship early, get feedback, digest that feedback, and make improvement. Agile or something. And what I've learned from the first two iterations of this is that I need to extend my methodology to the first round too. And also to French Rhum.
I also still need to think through how I map overlapping AOCs. And how I do the labelling when there's so much repetition. Do you like wine @undertheraedar? I might need to call in a favour.
@undertheraedar But first the data analysis. We're now beyond the Excel and QGIS stage. This needs reproducible and fast analysis (so I can do lots of rounds of analysis). For most people that means Python or R. For me that means C# .NET in Visual Studio. It's what I'm used to and it's fast.
@undertheraedar One of the reasons I love @datagouvfr -- the discussions are fantastic. Here, someone has asked the same question I had about Champagne, and the data owner has replied with an explanation and a promise to work on the solution. Really good stuff.

• • •
Missing some Tweet in this thread? You can try to
force a refresh


