MARKET NETFLOW TO THE WEBSITE 🥳
Market net flow is now available on the Options Market Dashboard on the website. Enjoy, and put in the work to prepare for your week
Dashboard link: tradytics.com/options-market
Market net flow is now available on the Options Market Dashboard on the website. Enjoy, and put in the work to prepare for your week
Dashboard link: tradytics.com/options-market

For those who are new and don't know what Algo or Net flow is, here's a video on the topic -
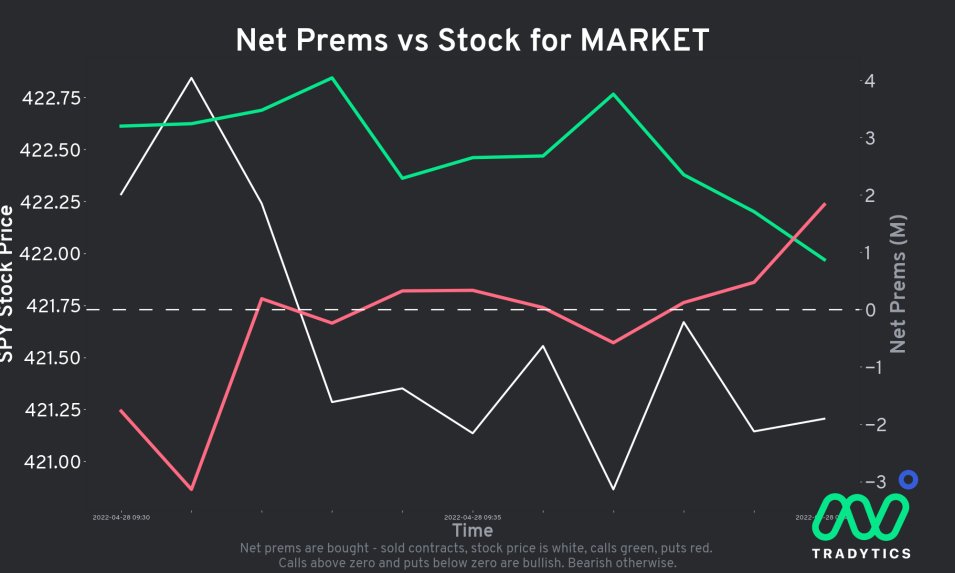
Market flow is simply a generalization of Net flow for all stocks in the market.
Market flow is simply a generalization of Net flow for all stocks in the market.
Will this be available on mobile? Not for another 3 months at least. Please don't ask again in every tweet I make 🙏
Is this live? The data is updated every 1 minute, but you do need to refresh to see new data. Auto-refresh will be there very soon.
Is this live? The data is updated every 1 minute, but you do need to refresh to see new data. Auto-refresh will be there very soon.
Thank you for your patience, and have a wonderful week. Happy to answer any questions.
• • •
Missing some Tweet in this thread? You can try to
force a refresh