Robert Griffin Profile picture
May 12 10 tweets 4 min read
#AAPOR ICYMI

@johnmsides and I examined major explanations for polling error in 2020.

The big takeaway:
Evidence that highly engaged Democrats were a big contributor to the problem in 2020. Reweighting by in-cylce measures of participation substantially reduced error.
Taking it from the top:
pre-election polling in 2020 was...not great.
One line of thought people had directly after the election:
-non-response by those low in social capital/trust might be causing these errors
-reweighting by some measure of social capital/trust might reduce error
Replicating some of the work Pew had done comparing prob/non-probability samples, we examined how this weighting scheme would affect the overall accuracy of a sample.

Short answer: Potentially helped reduce bias, but the effect was rather small.
The effect is even smaller on political variables. Has a negligible impact, if any.
Didn't explore this follow-up point by @davidshor. May be something we look at in the next iteration.
An alt explanation for '20 polling errors: Too many highly engaged, loyal democrats.

As proxied by participation in the '20 presidential primary, we find robust evidence for this. Too many primary voters and dem primary voters (even after weighting by '16 vote).
Reweighting by primary participation does a lot to reduce error. That's true using both voter validated participation in the primary or self-report.

Probably not a fluke either - there's a pretty consistent effect over 8/10 pre-election waves of the Nationscape survey.
This leads us to some tentative conclusions...
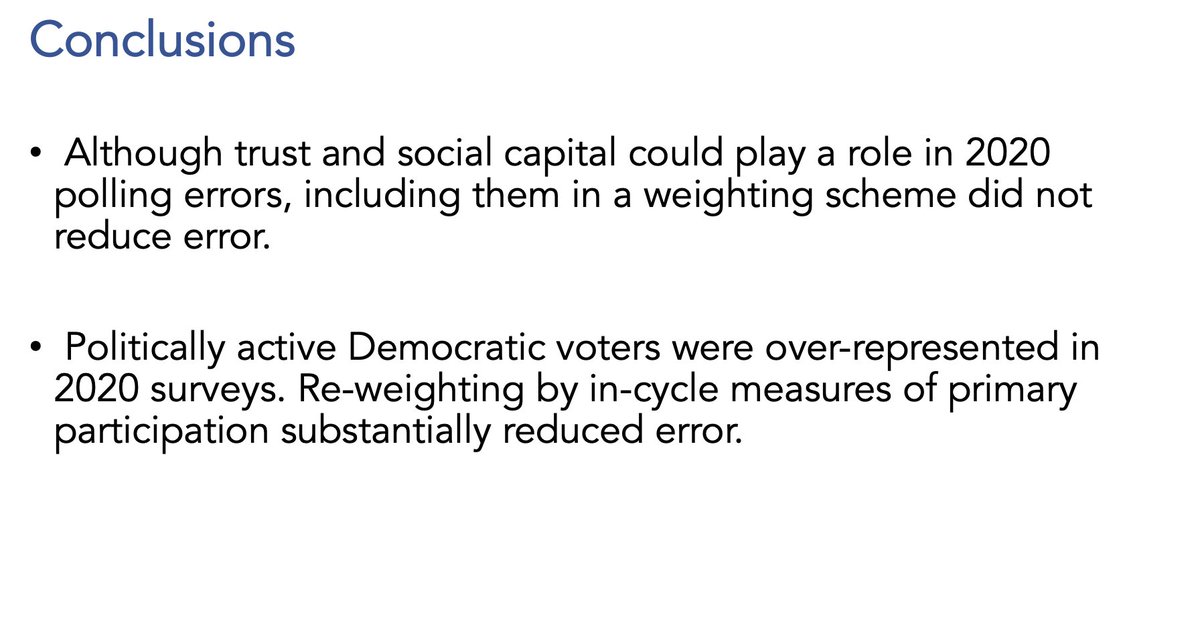
BUT also some substantial questions that are still up in the air.

Uncertain how generalizable these results are (though I have quietly heard other folks had these same primary participation biases) and uncertain how actionable this is in future elections.

• • •

Missing some Tweet in this thread? You can try to force a refresh
 

Keep Current with Robert Griffin

Robert Griffin Profile picture

Stay in touch and get notified when new unrolls are available from this author!

Read all threads

This Thread may be Removed Anytime!

PDF

Twitter may remove this content at anytime! Save it as PDF for later use!

Try unrolling a thread yourself!

how to unroll video
  1. Follow @ThreadReaderApp to mention us!

  2. From a Twitter thread mention us with a keyword "unroll"
@threadreaderapp unroll

Practice here first or read more on our help page!

More from @rp_griffin

Oct 21, 2021
🚨New Report🚨 Mayesha Quasem, @johnmsides, Michael Tesler, and I track shifts in racial attitudes over a decade, discuss Trump's part in that story, look at the effects of the Floyd protests, and discuss the sobering limitations of these changes.
[thread]
voterstudygroup.org/publication/ra…
Americans' views on systemic racism have shifted dramatically over the last decade, driven exclusively by shifts among Dems and Inds. GOP views have held constant.

Changes among Dems have occurred across racial lines - narrowing the gaps between Black Dems and others.
These changes are all the more notable because of the relative stability of these views since the late 80s (as highlighted by @_amengel chart)
dataforprogress.org/blog/2019/3/20…
Read 14 tweets
Jul 8, 2021
Big finding floating around today is that White Mainline Protestants (WMP) are rising. I'm a little skeptical.

- Unlikely that these changes would be caused by generational change. The other option is conversion.
- Not seeing those kinds of conversions in panel data.

[thread]
To start, this is not a take-down thread or anything like that. I'm trying to put puzzle pieces together and things aren't quite lining up. That's worth talking about even if I'm not quite sure what it means. Lots of respect for the PRRI team and the work they've done.
Big findings are a) WMP is up ~3pts and b) unaffiliated are down ~2pts over the last two years.

First question I ask: Might this be the result of changes in identity (i.e. conversion) or due to underlying demographic changes?
Read 9 tweets
Jul 1, 2021
@SeanTrende @jon_m_rob @NickRiccardi -Some demo cuts work the same way across White/Latino populations (e.g. age and gender).
-I'm more skeptical of the edu gap. Would be nice to see consistency across samples and I don't believe that's happening. E.g. the edu divide goes the other way in LD's post-election survey. Image
@SeanTrende @jon_m_rob @NickRiccardi I'd have to check but I think some of the last weeks of Nationscape data look closer to LD's story about the edu gap than Pew's.
@SeanTrende @jon_m_rob @NickRiccardi If anything, the "traditional" education gap among API voters is something we saw more consistently in our data.
Read 4 tweets
May 3, 2021
New VSG brief out today!

@AEI's Karlyn Bowman and @samanthagoldst dive into the VOTER's surveys post-election data on voting experiences in 2020 and confidence in the results. 1/N

voterstudygroup.org/publication/vo…
As noted by many, the rates of voting by mail soared this year.

While roughly similar numbers of Democratic and Republican voters cast their ballot by mail in 2016, there were substantial partisan divides in 2020. 2/N
Overall, relatively few reported experiencing problems voting (likely a testament to the time and energy that was put into making sure it went off smoothly).

Notably, Latinos were something of an outlier - more likely to report experiencing a problem on multiple questions. 3/N
Read 4 tweets
Nov 10, 2020
New @monkeycageblog piece this morning on problems with the Exit Polls.

Some are in a rush to explain what happened, but readily apparent issues with the Exit Polls should make folks skeptical about using them to do that storytelling. [thread]
washingtonpost.com/politics/2020/…
Short version:
-Historically, the exit polls have had race/edu composition issues.
-It happened again. The Exit Polls are under-reporting the share of the electorate that is white non-college.
-This has effects that can ripple throughout the survey, influencing the vote margins.
In '16, both States of Change (modeling ACS+CPS) and Pew's voter validation study said that 74% of voters were white, including 44% white noncollege. Assuming relative turnout stays the same and you get 72% and 41% in '20. Will likely be a little different, but a good baseline.
Read 11 tweets
Oct 24, 2019
*New Blog Post*

While the conversation around the Democratic Primary is currently focused on those candidates' electability, there’s another candidate with an electability challenge:
President Donald Trump.

Let's walk through the key takeaways. 1/N

voterstudygroup.org/blog/early-sig…
1) One of the most durable features of Trump’s presidency is his unpopularity. His approval/ favorability # is stable but also low given the economy. Worse, his support is relatively "soft". His very unfavorable # is about twice as large as his very favorable # (49% v. 25%). 2/N
We see this in key voting groups. Majorities of Obama-Clinton(92%), Romney-Clinton (70%), and Obama-Other (70%) voters have a v. unfavorable view.

Only among Romney-Trump voters do a majority (67%) have a v. favorable view - a view shared by just 39% of Obama-Trump voters. 3/N
Read 13 tweets

Did Thread Reader help you today?

Support us! We are indie developers!


This site is made by just two indie developers on a laptop doing marketing, support and development! Read more about the story.

Become a Premium Member ($3/month or $30/year) and get exclusive features!

Become Premium

Don't want to be a Premium member but still want to support us?

Make a small donation by buying us coffee ($5) or help with server cost ($10)

Donate via Paypal

Or Donate anonymously using crypto!

Ethereum

0xfe58350B80634f60Fa6Dc149a72b4DFbc17D341E copy

Bitcoin

3ATGMxNzCUFzxpMCHL5sWSt4DVtS8UqXpi copy

Thank you for your support!

Follow Us on Twitter!

:(