Nitin R Profile picture
May 13, 2022 9 tweets 4 min read Read on X
#WeeklyIndexCheck CW19/2022

Market Quadrant:
⦿ Trend: Confirmed Downtrend
⦿ Momentum: Negative & worsening
⦿ Breadth: Worsening & oversold
⦿ Bias: Bearish on all timeframes Image
Trend

⦿ Almost all indices are in confirmed downtrend
⦿ Only PSE, Power & Energy in uptrend under pressure
⦿ No index in confirmed uptrend Image
Momentum

⦿ Almost all indices (including Nifty, Banknifty, CNX500, Midcap, Smallcap) have negative & worsening momentum.

⦿ Only Energy & Power still have positive (but worsening) momentum Image
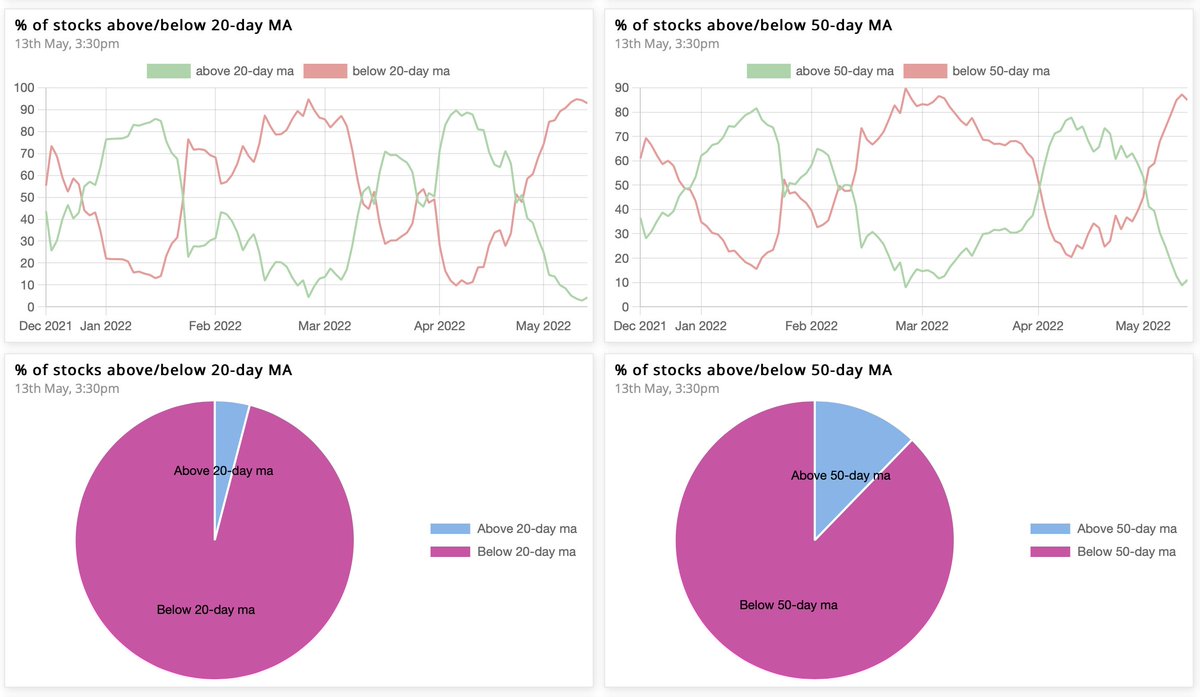
Market breadth worsening on all timeframes. Higher timeframes have bearish bias, while lower & intermediate ones well oversold.

⦿ 9% → 4% above 20MA (highly oversold)
⦿ 30% → 11% above 50MA (oversold)
⦿ 31% → 20% above 150MA (bearish)
⦿ 35% → 25% above 200MA (bearish) Image
% of stocks above/below 20& 50MA

The Ratio between stocks above & below 50MA is 0.14, while that for 20MA is 0.04.

The 10-day cumulative ratio for stocks above 50MA is 0.3 now. A value >2 is good for swing trades on the long side. Image
Bias

On a modified Stockbee market monitor, the short-term indicator of 13% up in 34 days was already negative since past week.

Now, the intermediate 25% plus in a month & long-term metric of stocks 25% plus quarter are also negative. Image
4% up/down in 1 day

The 10-day cumulative ratio (10-DCR) between stocks up & down 4% in a day is now below 0.5, & an indication of a bearish breadth thrust.

When market is in bearish phase, a fresh bull move starts when 10-DCR first time crosses above 2. Image
Primary Breadth Ratio

Overall, the market is now bearish, as the number of stocks up 25% plus in a quarter is now lesser than that down 25% plus in a quarter. The ratio between the two is the primary breadth ratio, which is now 0.29. Image
That’s all for this week. If you'd like to read this as a newsletter, find it here:

world.hey.com/nitinranjan/we…

• • •

Missing some Tweet in this thread? You can try to force a refresh
 

Keep Current with Nitin R

Nitin R Profile picture

Stay in touch and get notified when new unrolls are available from this author!

Read all threads

This Thread may be Removed Anytime!

PDF

Twitter may remove this content at anytime! Save it as PDF for later use!

Try unrolling a thread yourself!

how to unroll video
  1. Follow @ThreadReaderApp to mention us!

  2. From a Twitter thread mention us with a keyword "unroll"
@threadreaderapp unroll

Practice here first or read more on our help page!

More from @finallynitin

Feb 20
For identifying leading stocks during a bear market, @markminervini identifies three key setups based on the market phases where stocks set up.

A thread 🧵

The 3 market phases & their setups are:

1. Predictive - The market is making lows, & is not sure if it has bottomed out.

2. Coincident - The market has bottomed & given a follow through day, & most likely will resume its upward journey.

3. Confirming - The market has begun its upmove on the right side.Image
Predictive setups

Stocks setting up and breaking out before the market bottoms.

If the market makes another leg down, either these stocks will fail, or they might pull back to the breakout point but usually not stop you out.Image
Coincident setups

Stocks setting up once the market has bottomed & is giving a "follow-through day."

One sees stocks beginning to break out of their bases, usually on the fourth day or later, as the market is coming off the lows.Image
Read 5 tweets
Jan 9
The simplest way to judge if we're in a bear or a bull market is via the % of stocks above 200-day MA.

% of stocks above 200 MA sustaining for at least a month above 50 → Bull Market

% of stocks above 200 MA sustaining for at least a month below 50 → Bear Market

A thread 🧵Image
2018-2020

A ‘clean’ example of a bear market is from the period between Feb 2018 to Aug 2020, where the % of stocks above 200-day MA stayed below 50 levels almost throughout:Image
2020-2022

A ‘clean’ example of a bull market is from the period Aug 2020 to May 2022, where the % of stocks above 200-day MA stayed above 50 levels almost throughout:Image
Read 6 tweets
Aug 23, 2024
#MarketQuadrant CW34/2024:

An almost easy money market for a good stock selector. Hold on to your fully invested portfolio.
Anticipating a pullback/pause.

⦿ Swing: Confirmed Upswing
⦿ Momentum: Positive & Improving
⦿ Breadth: Strong
⦿ Bias: Positive
_______________________________________________

⦿ Trend (positional): Uptrend under pressureImage
Swing → Confirmed Upswing

⦿ Most broad indices are in a confirmed upswing. The Nifty 50 is still in an early upswing.

⦿ IT, Consumption, Consumer Durables, Oil&Gas & Pharma are notable sectoral indices in a confirmed upswing.

⦿ Swing Confidence is 75, which means that the portfolio can take significant open risk, but still less than the maximum permissible.Image
Momentum → Positive & Improving

⦿ Most broad & sectoral indices are having positive & improving momentum.

⦿ Media, Oil&Gas, Pharma & Realty are notable indices having positive but worsening momentum.

⦿ There is no index with negative momentum.Image
Read 6 tweets
Jun 22, 2024
Easy Earnings Comparison (EEC) 🧵

EEC is simply a high probability of reporting blockbuster results in the upcoming quarter, worthy of news headlines, leading to more inflows of liquidity.

The concept of EEC was explained in the book ‘Insider Buy Superstocks’ by Jesse Stine.Image
What is an Earnings Comparison?

An earnings comparison looks at a company’s earnings (or sales) from one quarter to the same quarter in the previous year. This is called an Year-over-Year (YoY) comparison.

For example, if a company had an EPS of 5.2 last year and this rises to 12.6 this year, that's a 140% increase.Image
Why Do Easy Earnings Comparisons Matter?

Let’s say the company posted an EPS of 12.6 again next quarter, but last year it had an EPS of 14.9 in that same quarter.

Even though the company is still making money, the YoY comparison shows a decline, which might not impress investors.Image
Read 5 tweets
Aug 10, 2023
Make a habit of following the system, & not take idiosyncratic decisions; the 'let’s-do-this-&-see-what-happens' trades.

Every loss must teach you something, & should not disappear in the ocean of random things that happen in your trading life.

Here are 4 of my worst mistakes… https://t.co/jVpP11eg4ftwitter.com/i/web/status/1…
Image
Mistake 1: Impatience
Trade exhibit: BSE

Entry (23-May-23): First pullback to the 20-day MA.
Exit (24-May-23): Exited in the backdrop of Nifty making something like an evening star, & the trade having no cushion.

Return: 0.28%
Potential: 180% upmove.

Learning: Impatience is… https://t.co/5pBUzHNZYStwitter.com/i/web/status/1…
Image
Mistake 2: Ego
Trade exhibit: ABB

Entry (06-Apr-23): Entered as price seemed to breakout of a multi-touch descending trendline.
Exit (11-Apr-23): Exited as SL got hit. Within a week, the price recovered & was back at the same levels, giving another opportunity that was not… https://t.co/s952z71rJKtwitter.com/i/web/status/1…
Image
Read 6 tweets
Jul 18, 2022
I have a very simple method for swing trading in cash stocks.

With a Tradingview script at the end, here is a thread🧵 on my Simple Swing strategy: 👇
The Simple Swing indicator is based on T3 Moving Average, which was first described by Tim Tillson, in the search for a “perfect” moving average.
The T3MA incorporates a smoothing technique which allows it to plot curves more gradual than common MA & with a smaller lag.

During most of the time in a trend, price will stay well away from the T3MA. Thus, a decisive close beyond the T3MA often indicates the end of a trend.
Read 11 tweets

Did Thread Reader help you today?

Support us! We are indie developers!


This site is made by just two indie developers on a laptop doing marketing, support and development! Read more about the story.

Become a Premium Member ($3/month or $30/year) and get exclusive features!

Become Premium

Don't want to be a Premium member but still want to support us?

Make a small donation by buying us coffee ($5) or help with server cost ($10)

Donate via Paypal

Or Donate anonymously using crypto!

Ethereum

0xfe58350B80634f60Fa6Dc149a72b4DFbc17D341E copy

Bitcoin

3ATGMxNzCUFzxpMCHL5sWSt4DVtS8UqXpi copy

Thank you for your support!

Follow Us!

:(