Nitin R Profile picture
Swing Trader | Pine Coder | Graphics Geek
3 subscribers
Feb 20 5 tweets 2 min read
For identifying leading stocks during a bear market, @markminervini identifies three key setups based on the market phases where stocks set up.

A thread 🧵

The 3 market phases & their setups are:

1. Predictive - The market is making lows, & is not sure if it has bottomed out.

2. Coincident - The market has bottomed & given a follow through day, & most likely will resume its upward journey.

3. Confirming - The market has begun its upmove on the right side.Image Predictive setups

Stocks setting up and breaking out before the market bottoms.

If the market makes another leg down, either these stocks will fail, or they might pull back to the breakout point but usually not stop you out.Image
Jan 9 6 tweets 2 min read
The simplest way to judge if we're in a bear or a bull market is via the % of stocks above 200-day MA.

% of stocks above 200 MA sustaining for at least a month above 50 → Bull Market

% of stocks above 200 MA sustaining for at least a month below 50 → Bear Market

A thread 🧵Image 2018-2020

A ‘clean’ example of a bear market is from the period between Feb 2018 to Aug 2020, where the % of stocks above 200-day MA stayed below 50 levels almost throughout:Image
Aug 23, 2024 6 tweets 4 min read
#MarketQuadrant CW34/2024:

An almost easy money market for a good stock selector. Hold on to your fully invested portfolio.
Anticipating a pullback/pause.

⦿ Swing: Confirmed Upswing
⦿ Momentum: Positive & Improving
⦿ Breadth: Strong
⦿ Bias: Positive
_______________________________________________

⦿ Trend (positional): Uptrend under pressureImage Swing → Confirmed Upswing

⦿ Most broad indices are in a confirmed upswing. The Nifty 50 is still in an early upswing.

⦿ IT, Consumption, Consumer Durables, Oil&Gas & Pharma are notable sectoral indices in a confirmed upswing.

⦿ Swing Confidence is 75, which means that the portfolio can take significant open risk, but still less than the maximum permissible.Image
Jun 22, 2024 5 tweets 3 min read
Easy Earnings Comparison (EEC) 🧵

EEC is simply a high probability of reporting blockbuster results in the upcoming quarter, worthy of news headlines, leading to more inflows of liquidity.

The concept of EEC was explained in the book ‘Insider Buy Superstocks’ by Jesse Stine.Image What is an Earnings Comparison?

An earnings comparison looks at a company’s earnings (or sales) from one quarter to the same quarter in the previous year. This is called an Year-over-Year (YoY) comparison.

For example, if a company had an EPS of 5.2 last year and this rises to 12.6 this year, that's a 140% increase.Image
Aug 10, 2023 6 tweets 4 min read
Make a habit of following the system, & not take idiosyncratic decisions; the 'let’s-do-this-&-see-what-happens' trades.

Every loss must teach you something, & should not disappear in the ocean of random things that happen in your trading life.

Here are 4 of my worst mistakes… https://t.co/jVpP11eg4ftwitter.com/i/web/status/1…
Image Mistake 1: Impatience
Trade exhibit: BSE

Entry (23-May-23): First pullback to the 20-day MA.
Exit (24-May-23): Exited in the backdrop of Nifty making something like an evening star, & the trade having no cushion.

Return: 0.28%
Potential: 180% upmove.

Learning: Impatience is… https://t.co/5pBUzHNZYStwitter.com/i/web/status/1…
Image
Jul 18, 2022 11 tweets 4 min read
I have a very simple method for swing trading in cash stocks.

With a Tradingview script at the end, here is a thread🧵 on my Simple Swing strategy: 👇 The Simple Swing indicator is based on T3 Moving Average, which was first described by Tim Tillson, in the search for a “perfect” moving average.
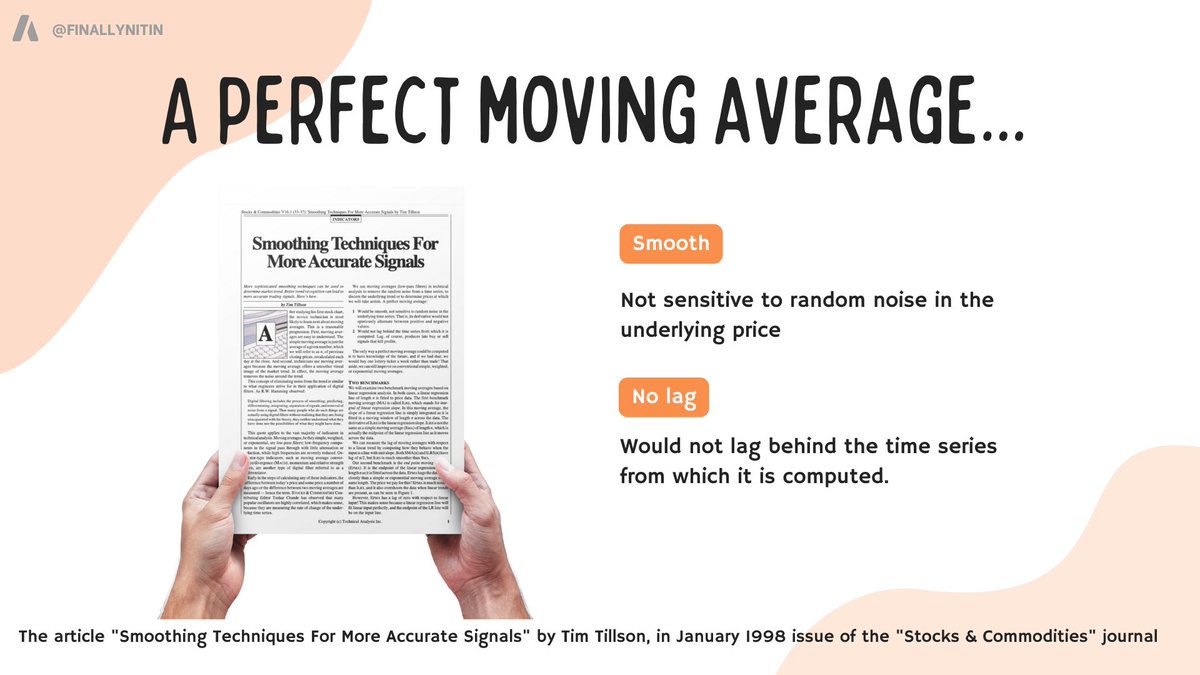
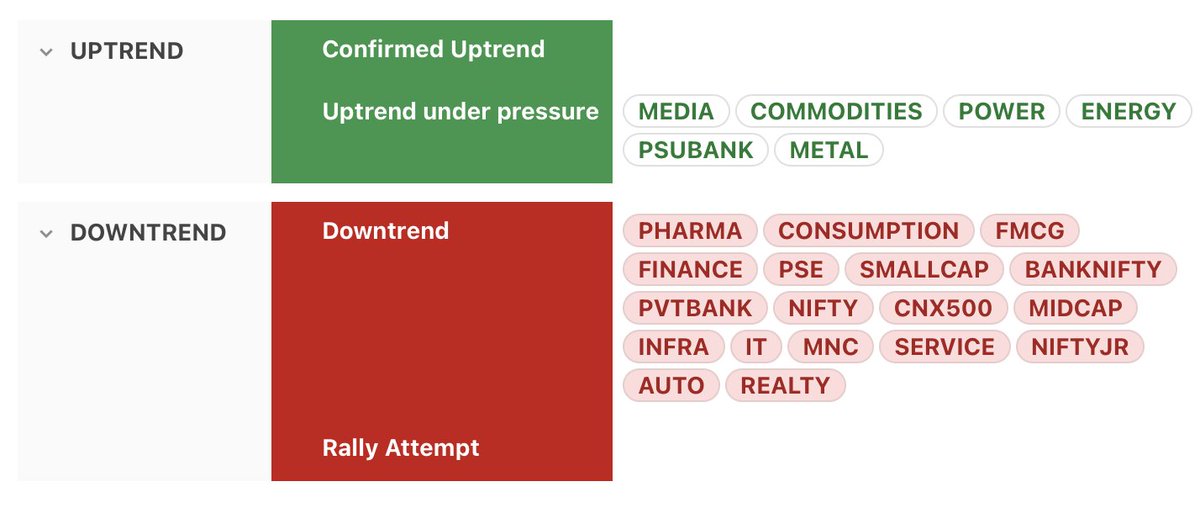
May 13, 2022 9 tweets 4 min read
#WeeklyIndexCheck CW19/2022

Market Quadrant:
⦿ Trend: Confirmed Downtrend
⦿ Momentum: Negative & worsening
⦿ Breadth: Worsening & oversold
⦿ Bias: Bearish on all timeframes Image Trend

⦿ Almost all indices are in confirmed downtrend
⦿ Only PSE, Power & Energy in uptrend under pressure
⦿ No index in confirmed uptrend Image
Apr 19, 2022 8 tweets 3 min read
The time has finally arrived to simplify how we use the volume indicator on our charts. With a Tradingview script at the end, here is a thread🧵 on what “simple” volumes are, & how to use them: 👇 Image The conventional volume indicator is full of ‘noise’ in that all volume bars are given the same importance. Color & size are the two informations they provide. But this information is “across the board”, irrespective of when it’s important enough or not. Image
Mar 5, 2022 5 tweets 2 min read
One of the strongest pattern is a gap-up on the weekly chart that stays unfilled. More often than not, the price will pullback & retest the high of the gap, & give us a buying oppurtunity.

e.g EXCELINDUS - entry above high of 24 Feb candle 
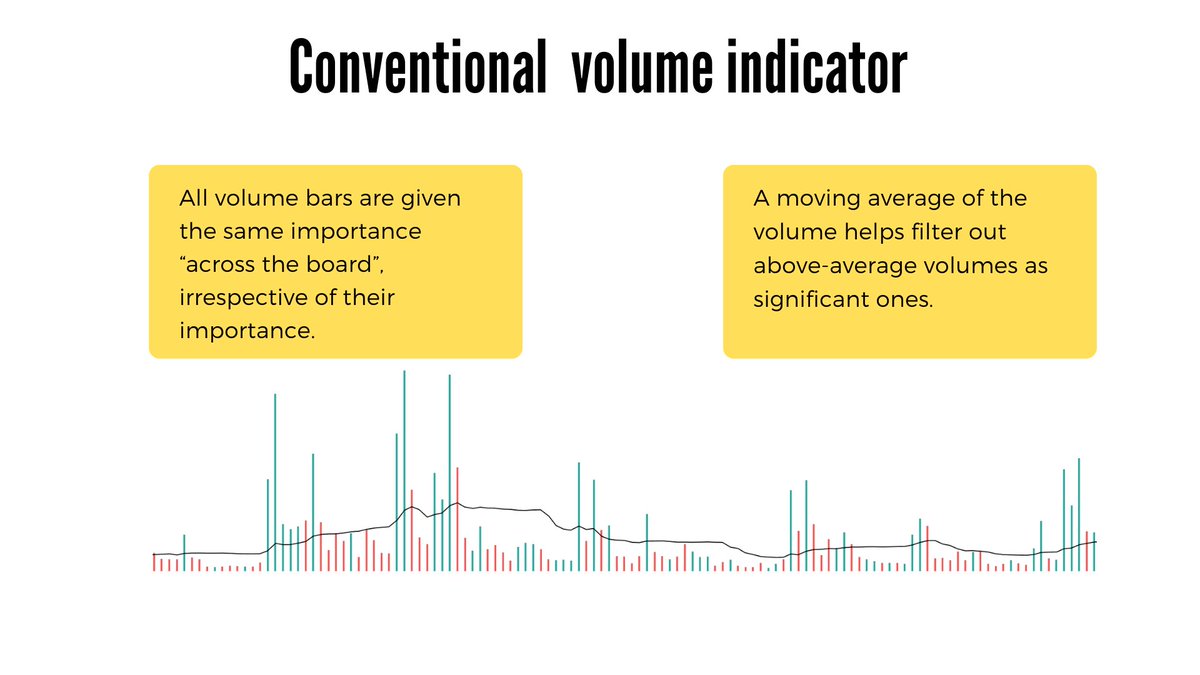
If this weekly gap-up coinicides with a new-high base breakout, it’s even much stronger. As per O’ Neil, gap-ups that are also base breakouts are the most powerful base breakouts.

e.g MBAPL - entry above high of 22 Feb candle
Mar 4, 2022 9 tweets 4 min read
#WeeklyIndexCheck CW09/2022

Market Quadrant:

⦿ Trend: Downtrend
⦿ Momentum: Negative & worsening
⦿ Breadth: Oversold
⦿ Bias: Bearish Trend

⦿ Most major indices (including Nifty, CNX500, Midcap, Smallcap) stay in downtrend.
⦿ Auto & Realty join the red list this week
⦿ Metals, PSUbank, Power & Energy stay in uptrend under pressure.
Sep 18, 2021 11 tweets 4 min read
Market breadth measures the degree of participation & the conviction in the overall mood of the underlying index. A positive market breadth is said to happen when more stocks are advancing than are declining.

A thread on how do we interpret market breadth👇 A simple way to measure market breadth is % of stocks trading above a certain moving average. When majority are above a specific MA, market breadth is termed strong.

We use 20 & 50-day MA for short to medium-term timeframes, & 150 & 200-day MA for medium to long-term timeframes. Image