#WeeklyIndexCheck CW19/2022
Market Quadrant:
⦿ Trend: Confirmed Downtrend
⦿ Momentum: Negative & worsening
⦿ Breadth: Worsening & oversold
⦿ Bias: Bearish on all timeframes
Market Quadrant:
⦿ Trend: Confirmed Downtrend
⦿ Momentum: Negative & worsening
⦿ Breadth: Worsening & oversold
⦿ Bias: Bearish on all timeframes

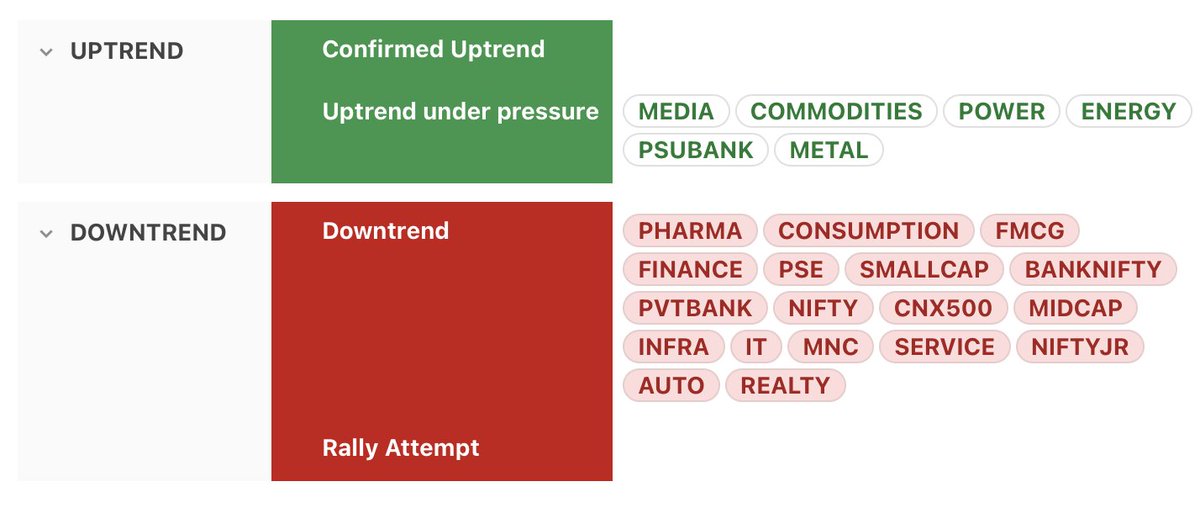
Trend
⦿ Almost all indices are in confirmed downtrend
⦿ Only PSE, Power & Energy in uptrend under pressure
⦿ No index in confirmed uptrend
⦿ Almost all indices are in confirmed downtrend
⦿ Only PSE, Power & Energy in uptrend under pressure
⦿ No index in confirmed uptrend

Momentum
⦿ Almost all indices (including Nifty, Banknifty, CNX500, Midcap, Smallcap) have negative & worsening momentum.
⦿ Only Energy & Power still have positive (but worsening) momentum
⦿ Almost all indices (including Nifty, Banknifty, CNX500, Midcap, Smallcap) have negative & worsening momentum.
⦿ Only Energy & Power still have positive (but worsening) momentum

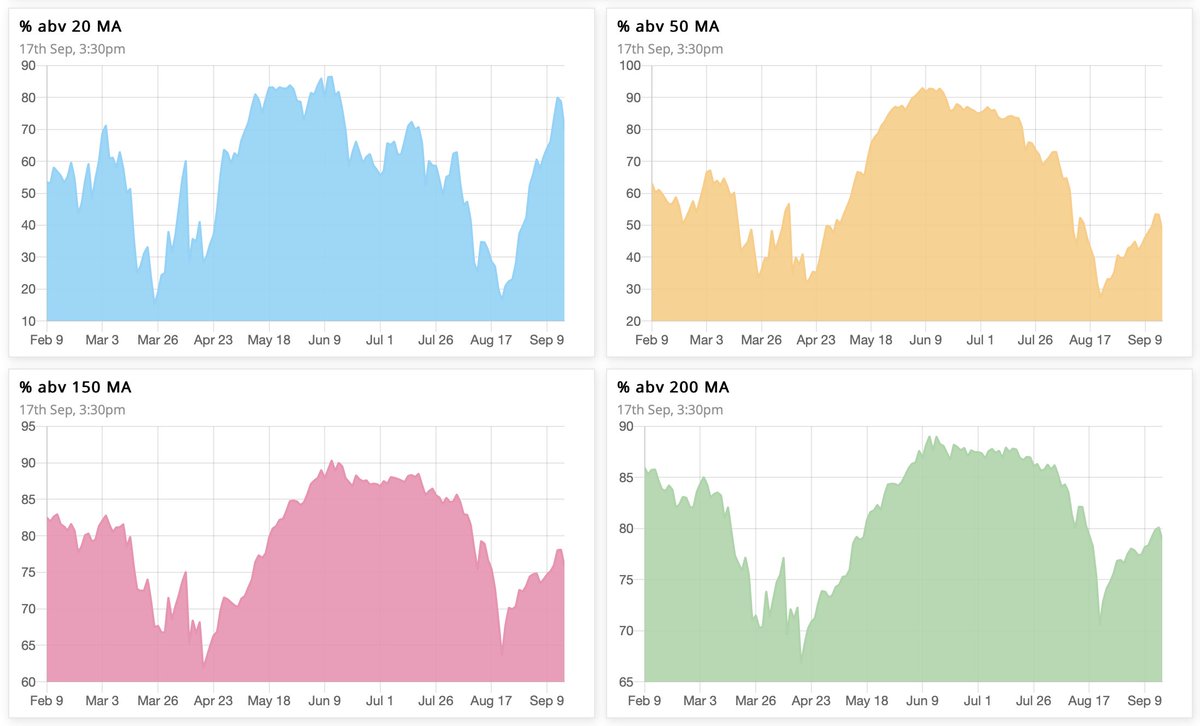
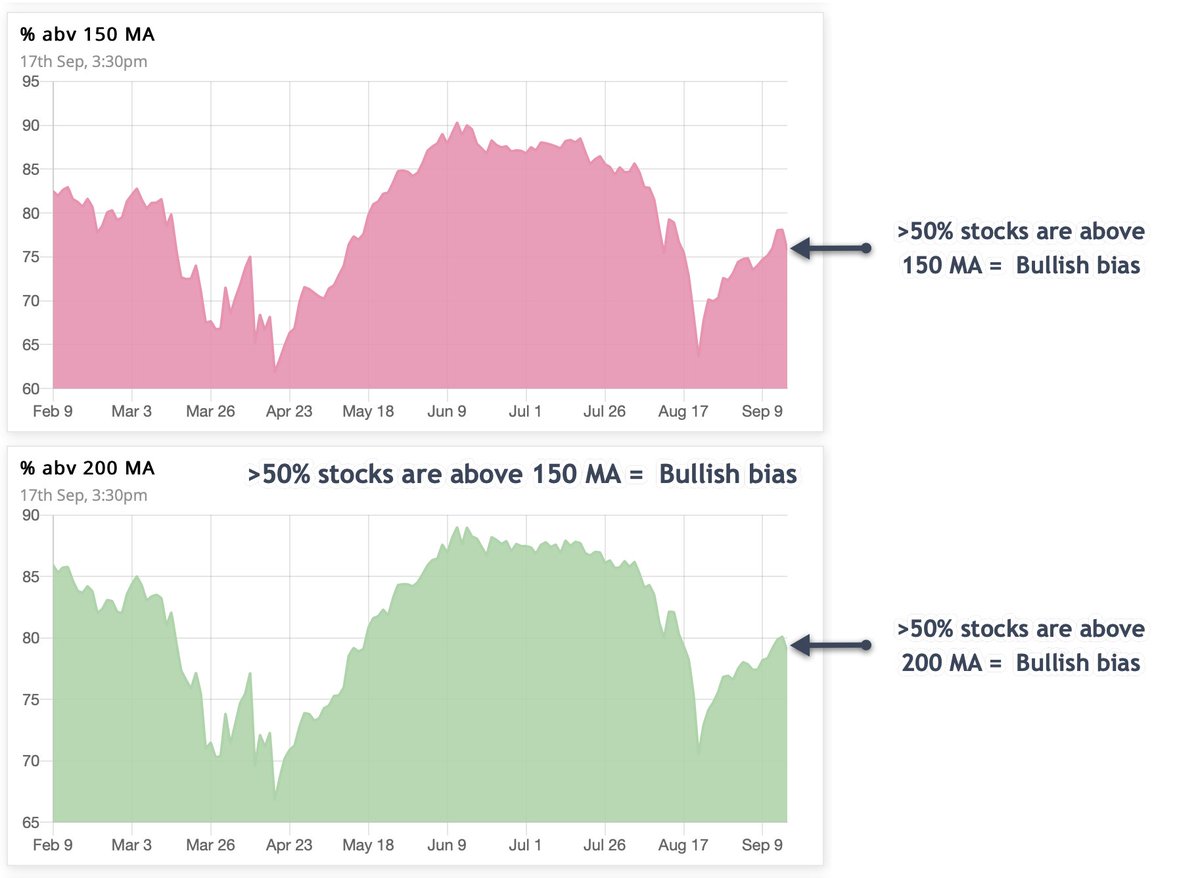
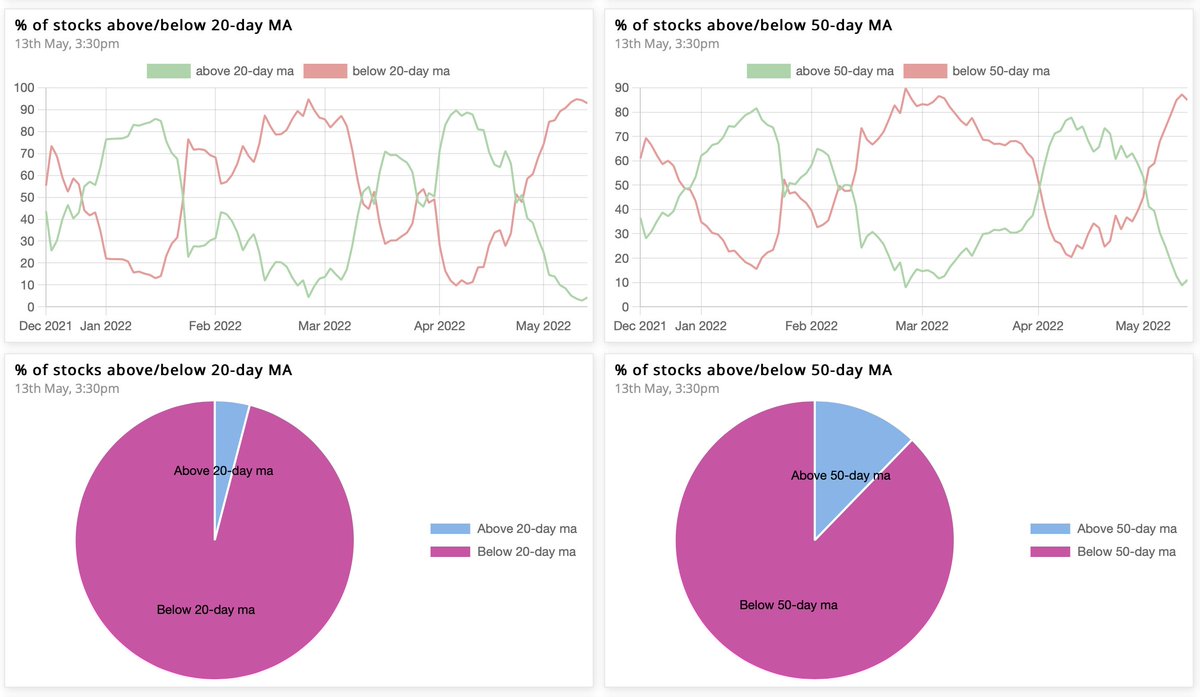
Market breadth worsening on all timeframes. Higher timeframes have bearish bias, while lower & intermediate ones well oversold.
⦿ 9% → 4% above 20MA (highly oversold)
⦿ 30% → 11% above 50MA (oversold)
⦿ 31% → 20% above 150MA (bearish)
⦿ 35% → 25% above 200MA (bearish)
⦿ 9% → 4% above 20MA (highly oversold)
⦿ 30% → 11% above 50MA (oversold)
⦿ 31% → 20% above 150MA (bearish)
⦿ 35% → 25% above 200MA (bearish)

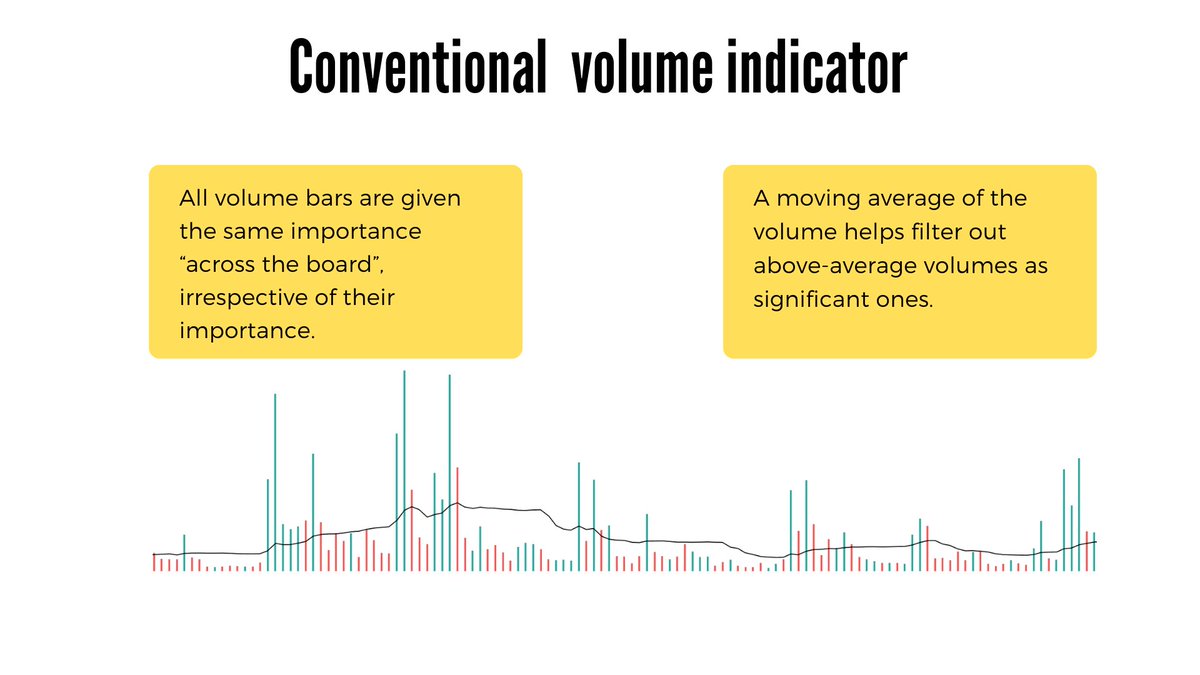
% of stocks above/below 20& 50MA
The Ratio between stocks above & below 50MA is 0.14, while that for 20MA is 0.04.
The 10-day cumulative ratio for stocks above 50MA is 0.3 now. A value >2 is good for swing trades on the long side.
The Ratio between stocks above & below 50MA is 0.14, while that for 20MA is 0.04.
The 10-day cumulative ratio for stocks above 50MA is 0.3 now. A value >2 is good for swing trades on the long side.
Bias
On a modified Stockbee market monitor, the short-term indicator of 13% up in 34 days was already negative since past week.
Now, the intermediate 25% plus in a month & long-term metric of stocks 25% plus quarter are also negative.
On a modified Stockbee market monitor, the short-term indicator of 13% up in 34 days was already negative since past week.
Now, the intermediate 25% plus in a month & long-term metric of stocks 25% plus quarter are also negative.

4% up/down in 1 day
The 10-day cumulative ratio (10-DCR) between stocks up & down 4% in a day is now below 0.5, & an indication of a bearish breadth thrust.
When market is in bearish phase, a fresh bull move starts when 10-DCR first time crosses above 2.
The 10-day cumulative ratio (10-DCR) between stocks up & down 4% in a day is now below 0.5, & an indication of a bearish breadth thrust.
When market is in bearish phase, a fresh bull move starts when 10-DCR first time crosses above 2.

Primary Breadth Ratio
Overall, the market is now bearish, as the number of stocks up 25% plus in a quarter is now lesser than that down 25% plus in a quarter. The ratio between the two is the primary breadth ratio, which is now 0.29.
Overall, the market is now bearish, as the number of stocks up 25% plus in a quarter is now lesser than that down 25% plus in a quarter. The ratio between the two is the primary breadth ratio, which is now 0.29.

That’s all for this week. If you'd like to read this as a newsletter, find it here:
world.hey.com/nitinranjan/we…
world.hey.com/nitinranjan/we…
• • •
Missing some Tweet in this thread? You can try to
force a refresh