
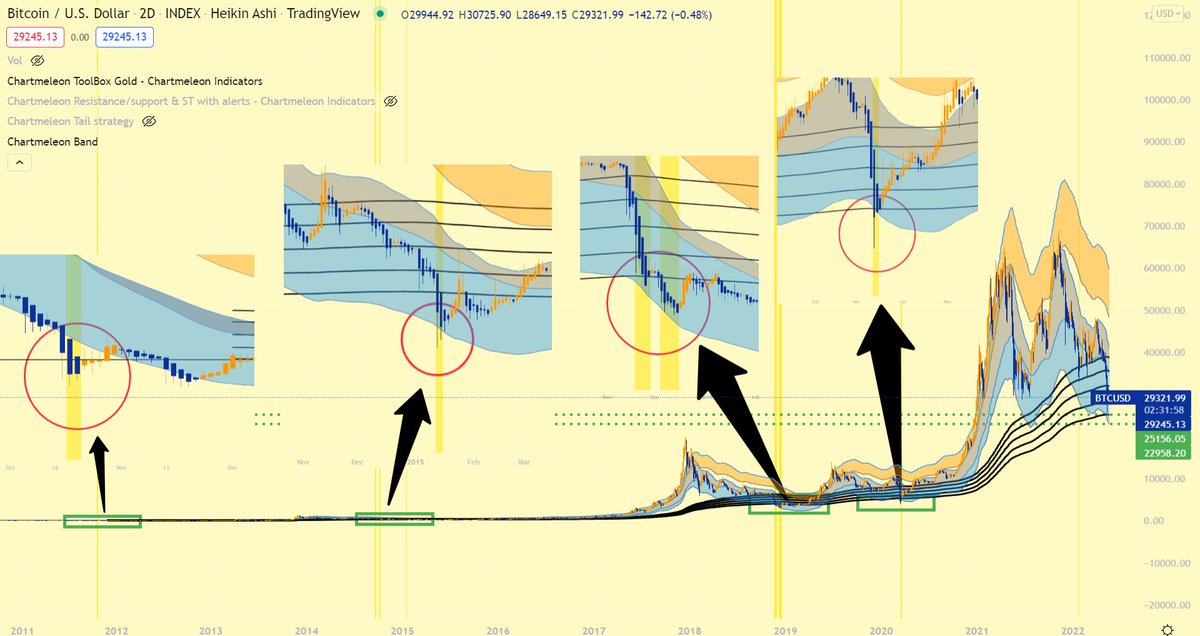
just finished a new indicator - the Chartmeleon Band
➡️ Let's have a look at the #BTC 2D chart:
➡️ conditions for Bottom:
1⃣ Price is under the black resistance lines
2⃣ Price touches the lower line of the blue area or is slightly below it
extra: 3⃣ haikin ashi RSI<20
/1
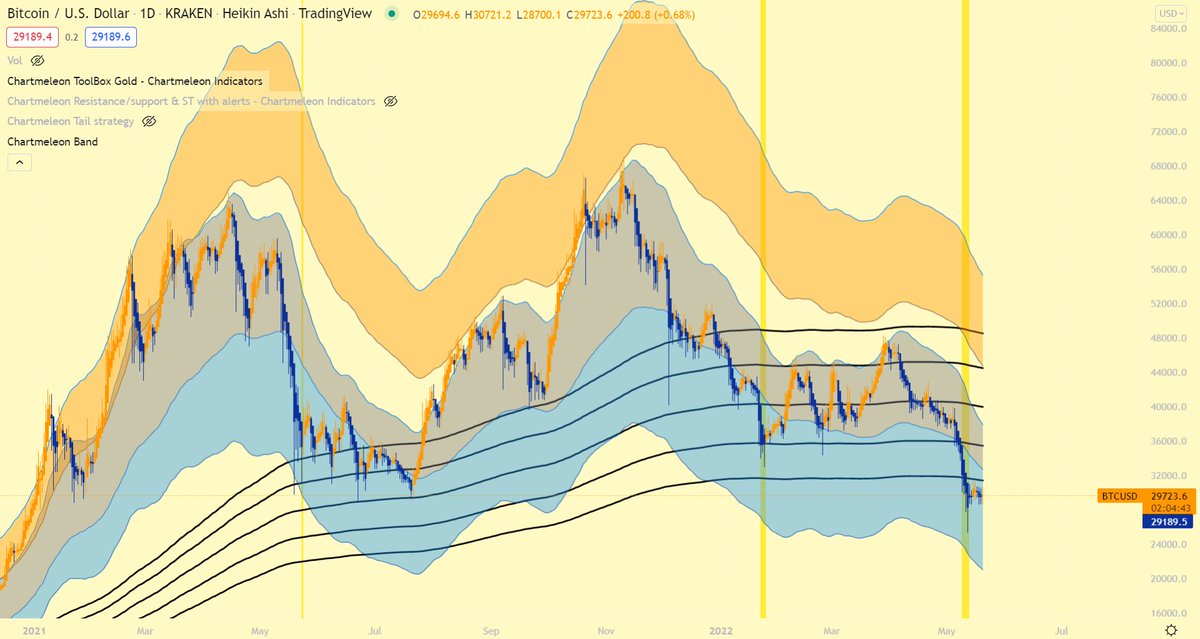
➡️ Let's have a look at the #BTC 2D chart:
➡️ conditions for Bottom:
1⃣ Price is under the black resistance lines
2⃣ Price touches the lower line of the blue area or is slightly below it
extra: 3⃣ haikin ashi RSI<20
/1
/2
atm #BTC got support @ the lowest black resistance line @ around 25.5k, didn't break through it and didn't touch the lower line of the blue area
➡️probably little more downside coming ➡️blue area lower line support atm on the 2D chart @ around 22.9k ➡️wick lower is possible
atm #BTC got support @ the lowest black resistance line @ around 25.5k, didn't break through it and didn't touch the lower line of the blue area
➡️probably little more downside coming ➡️blue area lower line support atm on the 2D chart @ around 22.9k ➡️wick lower is possible
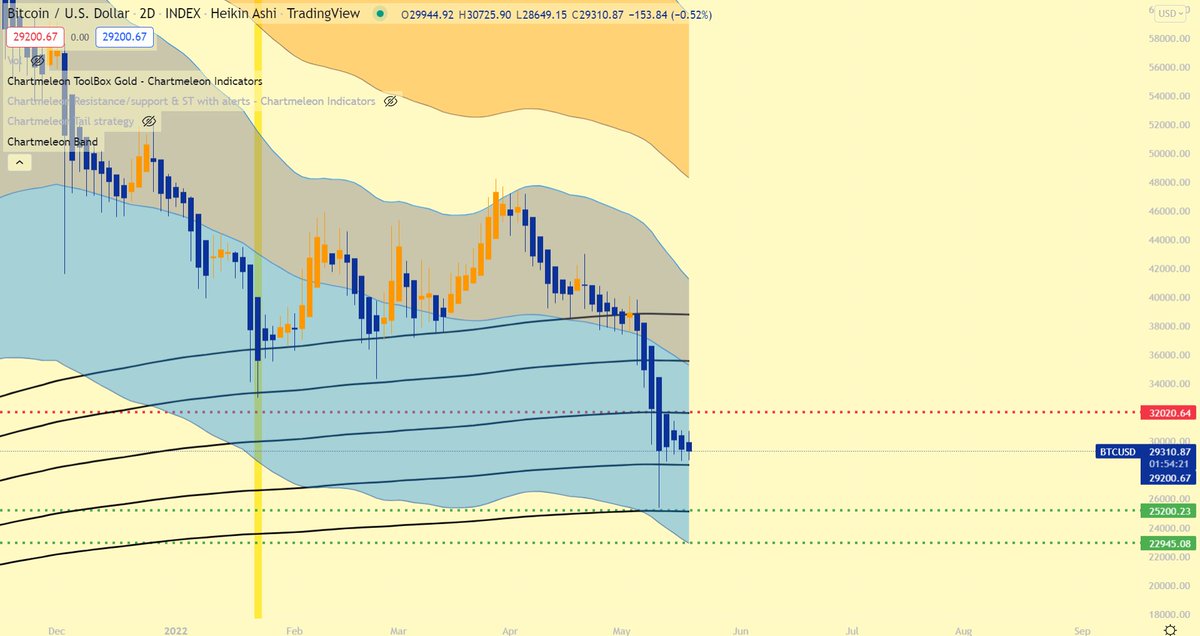
/3
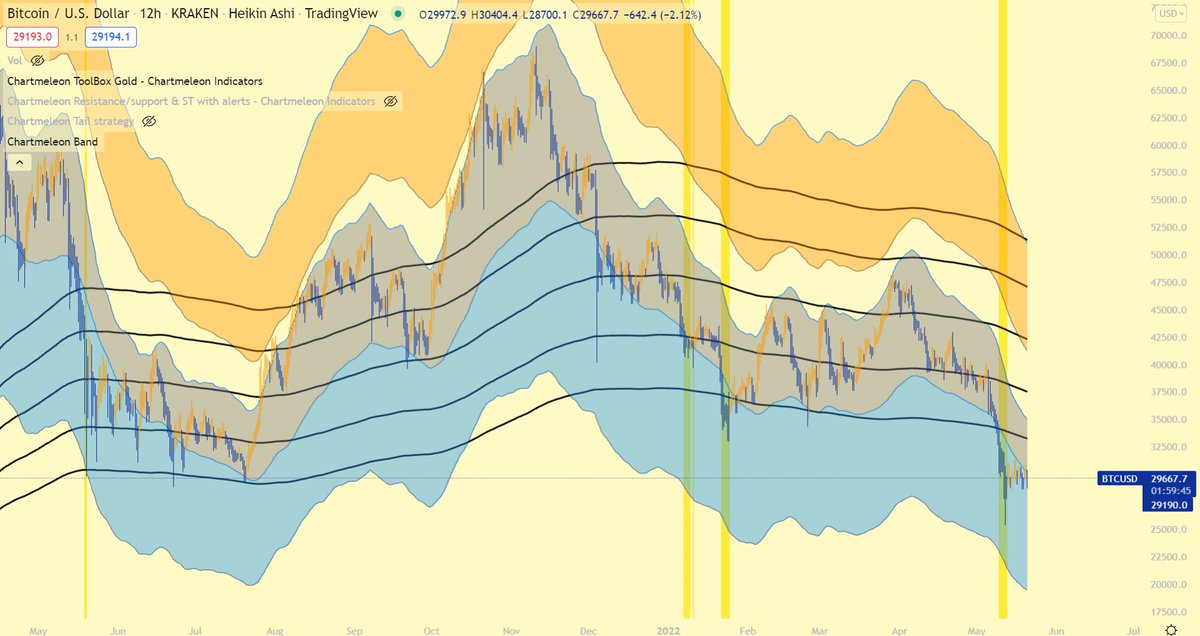
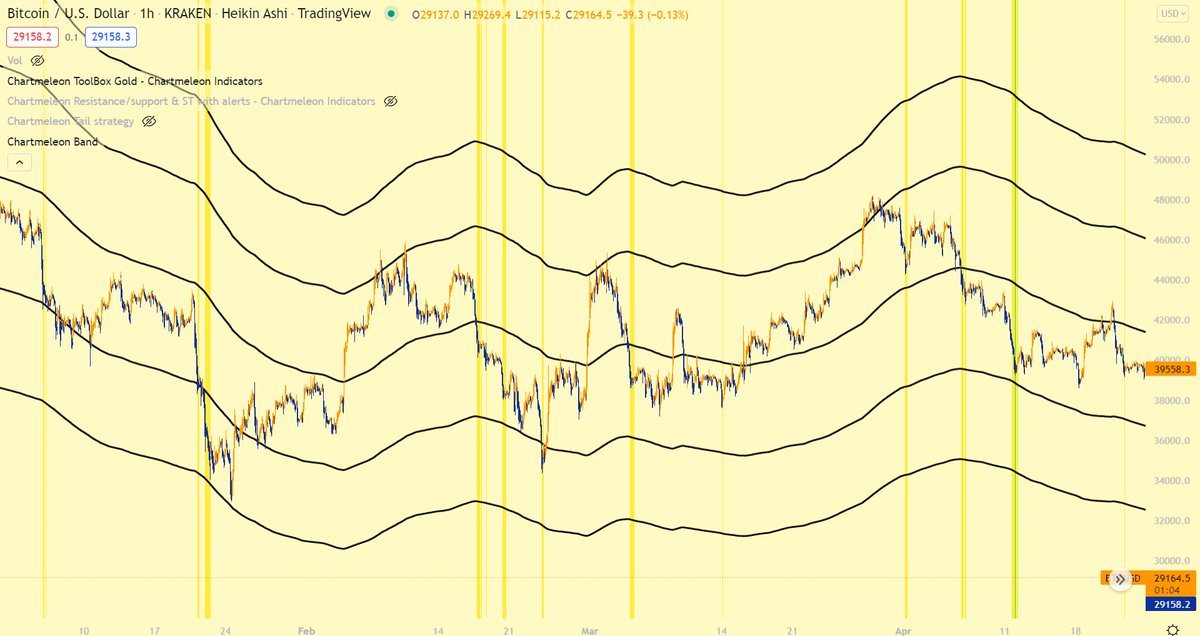
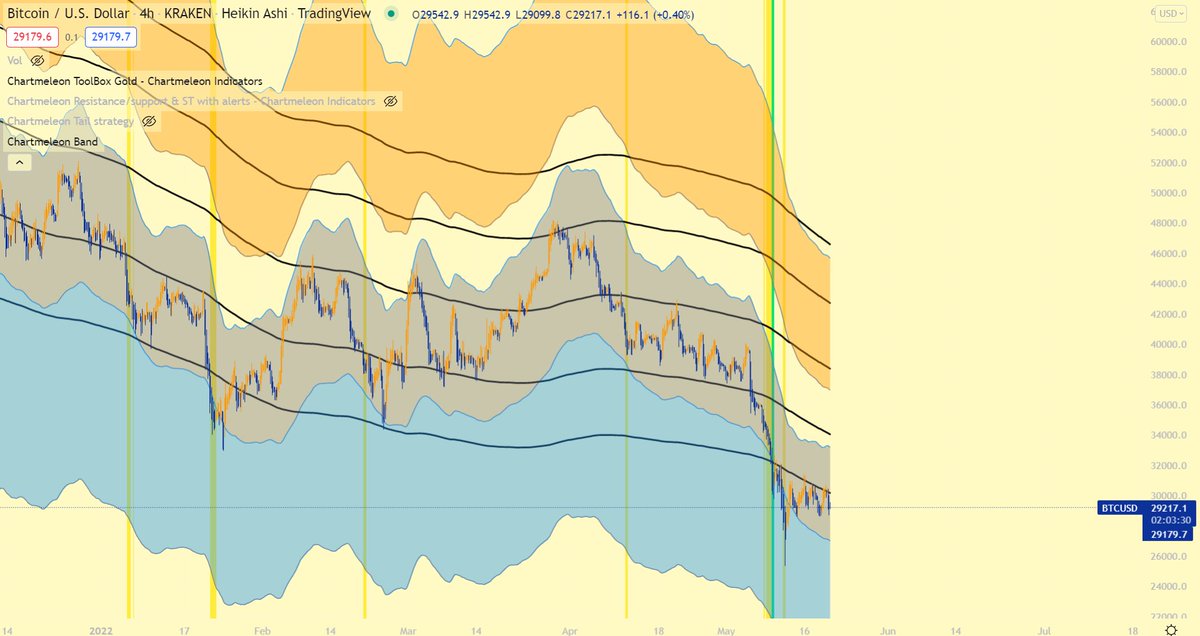
the chartmeleon band is used as support and resistance ➡️ best on higher TF, but also fine on lower TF
some examples ⬇️
the chartmeleon band is used as support and resistance ➡️ best on higher TF, but also fine on lower TF
some examples ⬇️
• • •
Missing some Tweet in this thread? You can try to
force a refresh


