COVID-19: Review of co2.click Canadian CO2 Monitor
I have been using a CO2 monitor for much of the pandemic to help measure ventilation quality in rooms. 🧵1/ @jljcolorado @DavidElfstrom @kprather88 @linseymarr @ShellyMBoulder @DGBassani @DFisman @lisa_iannattone
I have been using a CO2 monitor for much of the pandemic to help measure ventilation quality in rooms. 🧵1/ @jljcolorado @DavidElfstrom @kprather88 @linseymarr @ShellyMBoulder @DGBassani @DFisman @lisa_iannattone
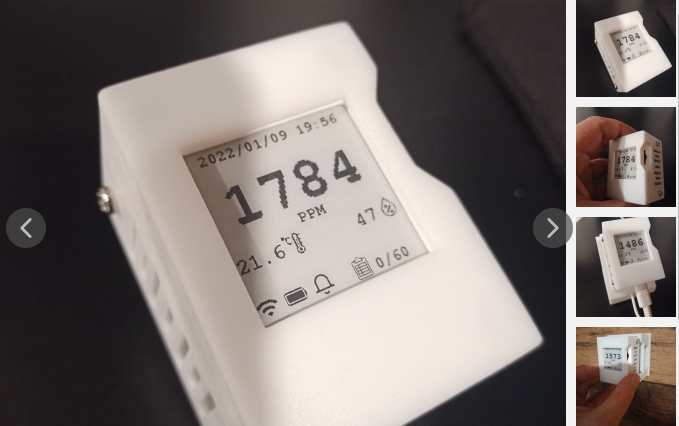
I had a lower quality CO2 monitor with single beam nondispersive infrared sensor (NDIR) but it automatically reset its calibration every week based on the lowest CO2 setting it saw so was a pain to manually calibrate on a regular basis to be accurate. 2/
I was then looking for a good dual-beam sensor based CO2 monitor but the most popular one the aranet4 was extremely hard to find in Canada at the time and very expensive. 3/
Then I was recommended to contact Canadian Engineer Andre Courchesne (@IndianaTux) who makes CO2 monitors using high quality Dual-Beam NDIR Swiss sensors and less than half the cost of an aranet4 pro. 4/
He sells two models right now, Model C and Model D which you can order online from his website ( co2.click ). Note, the prices are in Canadian dollars. 5/ 
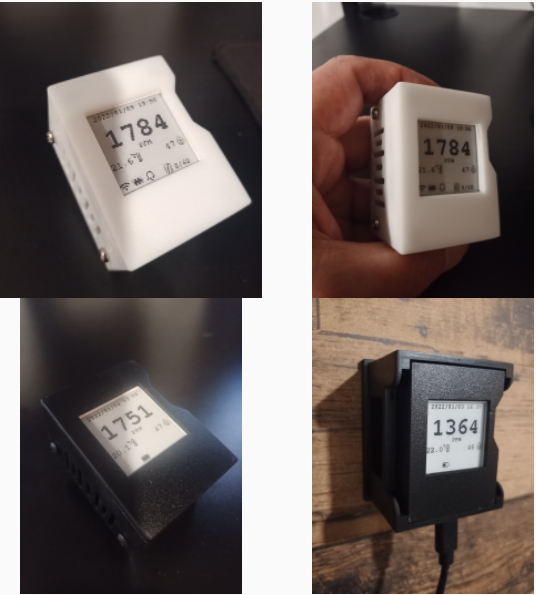
I purchased and have been using a Model C for almost 4 months now ( co2.click/ecommerce/en/M… ). Please note that I do not make any money on the sale of these monitors and I actually paid for the CO2 monitor that I'm reviewing, I just really like the product. 6/
You can see just how small the monitor is and easily fits in the palm of my hands. It uses an e-ink display that shows date, time, the CO2 level in parts per million (ppm), temperature, humidity level and status indicators such as WiFi, battery level, alerts, and memory level. 7/ 
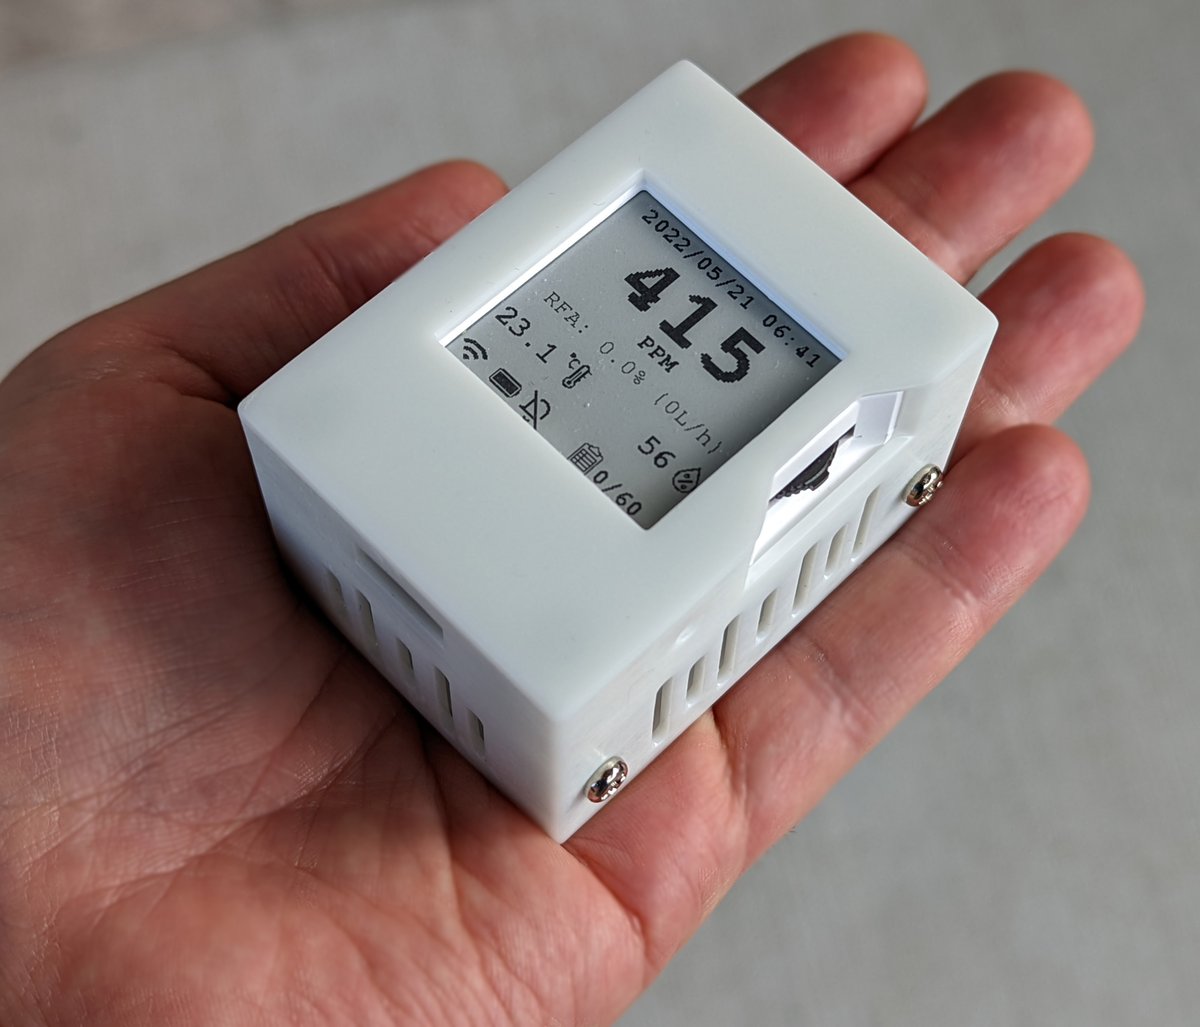
With the dual-beam NDIR sensor, I don't have to worry about calibration drift as much. The devices are calibrated outside to a 415 ppm baseline before being shipped and in the 4 months I have used it, I haven't had to recalibrate it once. 8/
As you can see the photo outside is still showing 415 ppm after 4 months. This sensor has an accuracy of +/- 30ppm ( sensirion.com/media/document… ). 9/ 
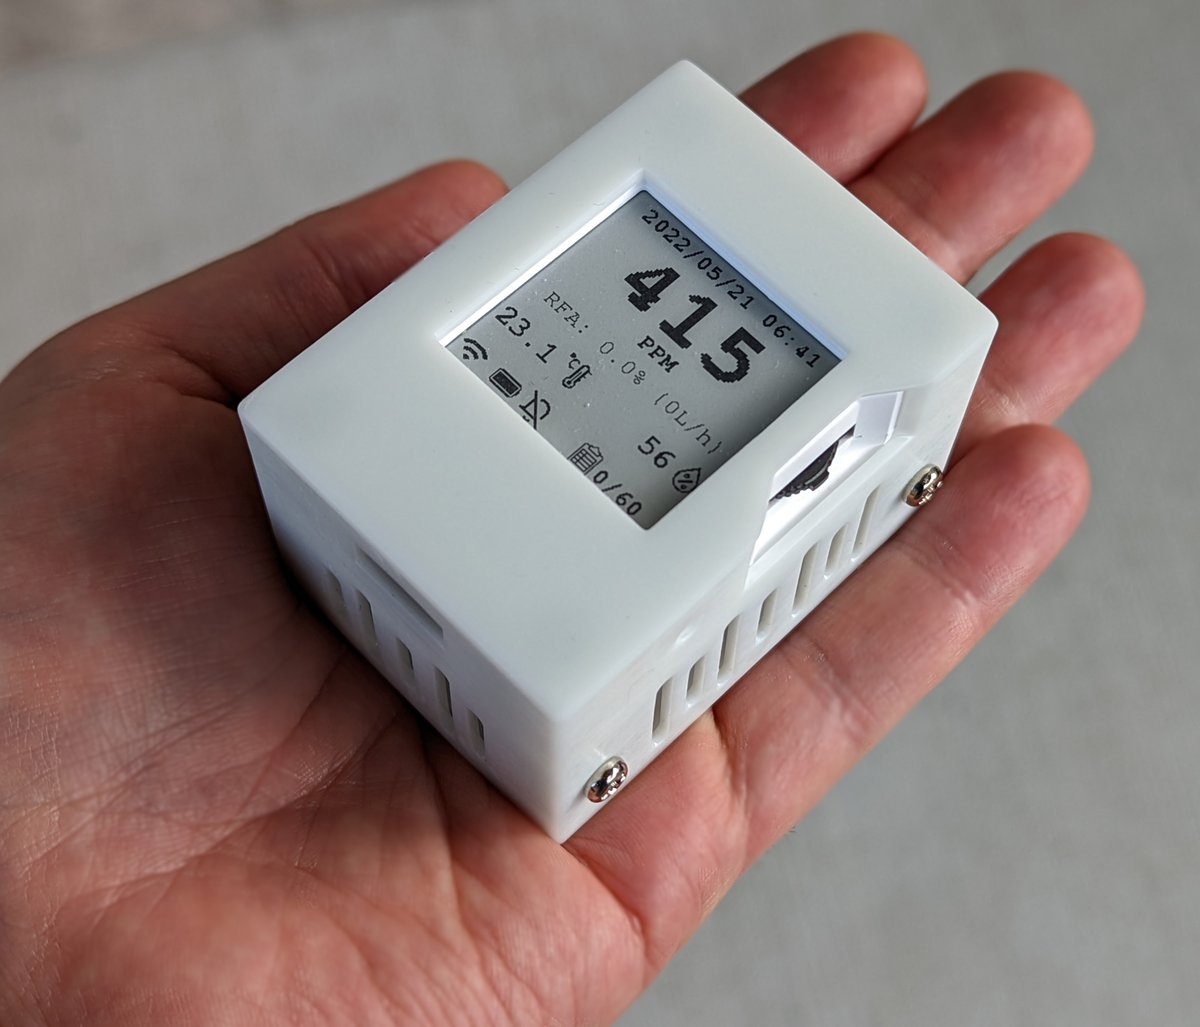
The Model C can be mounted on a wall (see photos on website) but there is also a desk stand that can be included with your order for a small cost. You can see the desk stand pictured here. 10/ 
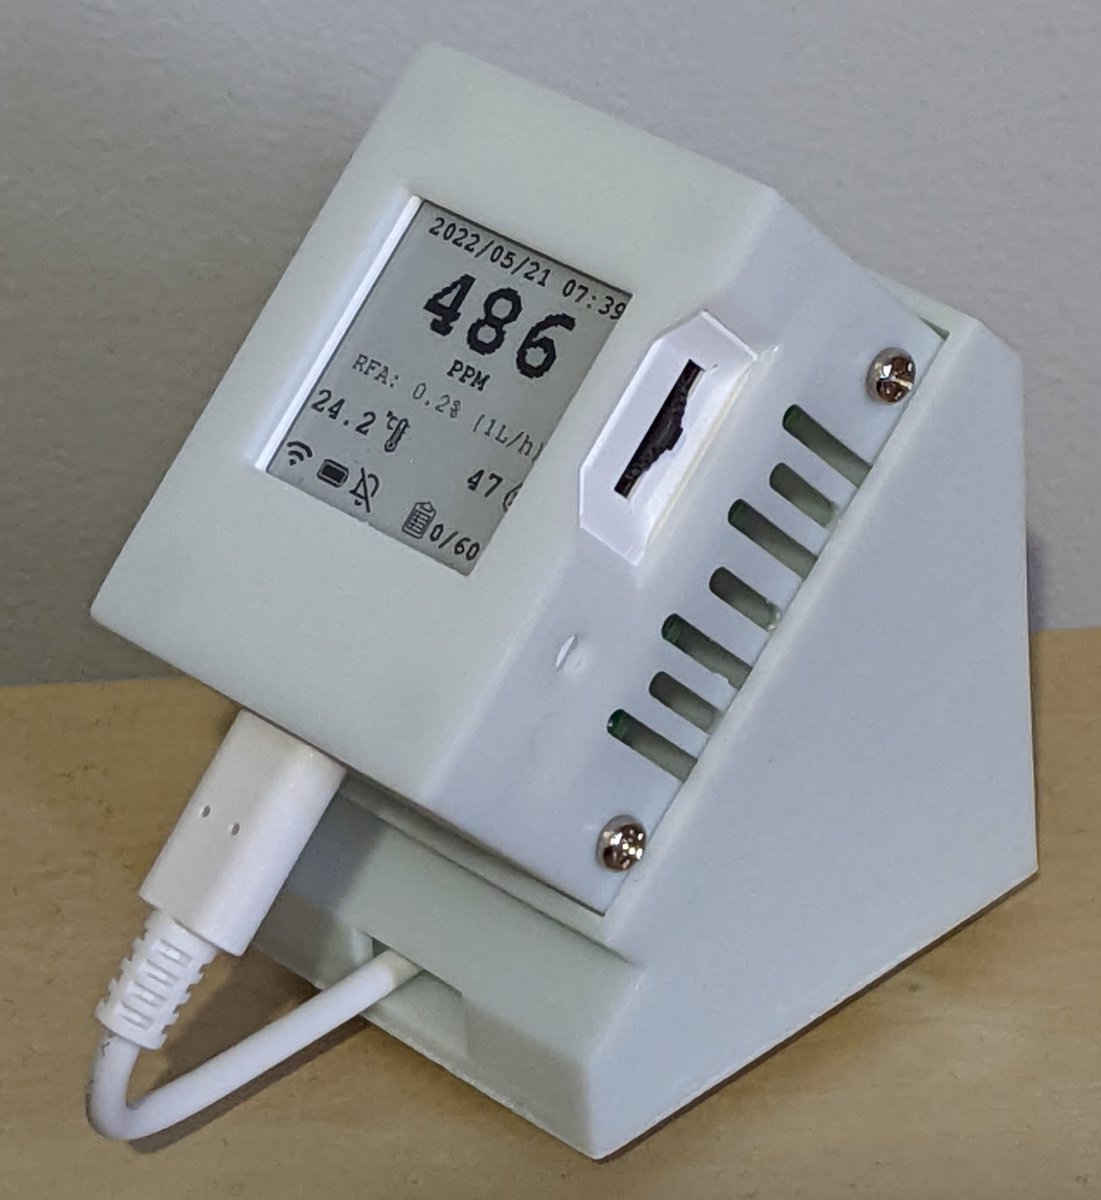
The best part is, that the device automatically uploads readings using WiFi to a cloud portal at the timed interval (15 minutes default). Access to the web portal is free and data is retained for 48 months. 11/
The cloud portal will also graph your sensor's results for the last 7 days, 48 hrs, 24 hrs, 12 hrs, 5 hrs, and last hour so you can quickly and visually see what the CO2 levels have been doing. The graph plots CO2 levels (green), humidity (blue) and temperature (purple). 12/ 
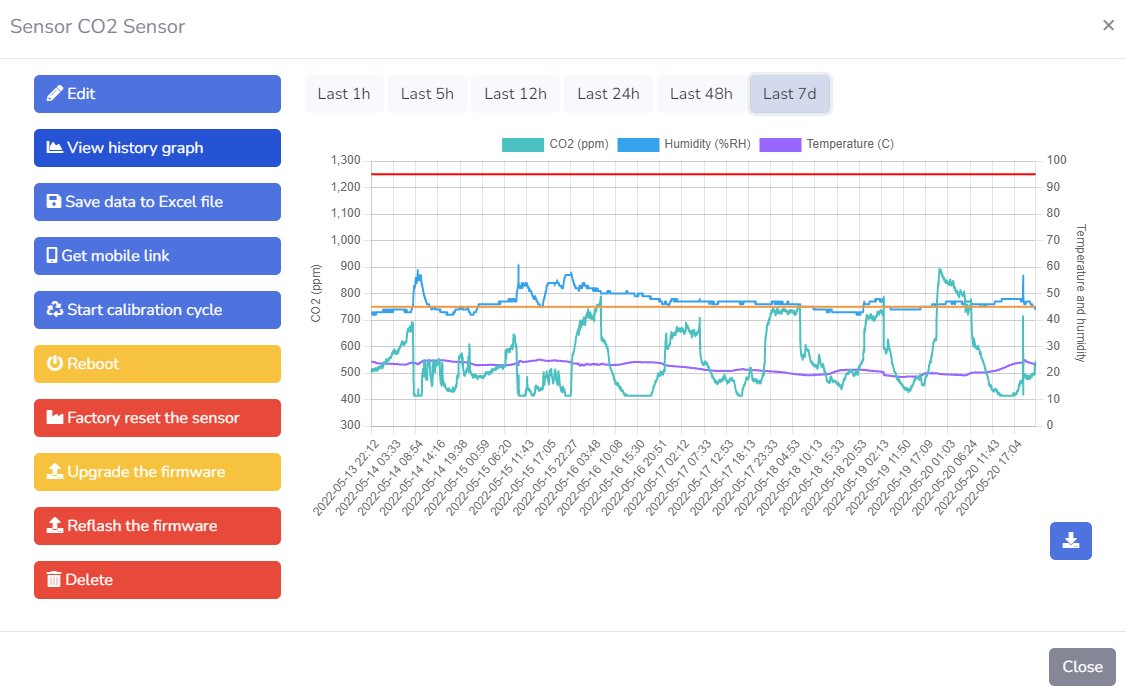
You can also download an image of the graph and even hide parts of it (hide humidity and temperature) as seen in the image. You can export the data in Excel spreadsheet format to save indefinitely yourself. 13/ 
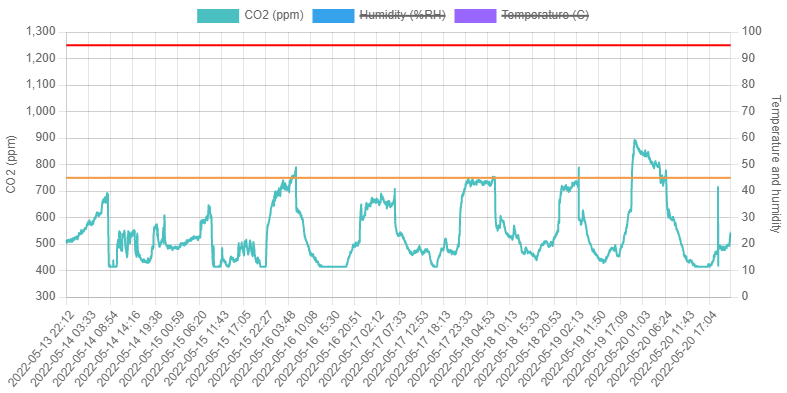
With the raw data you can do your own analysis and plot differences to discover that keeping a bedroom door open a crack at night makes a big difference in the CO2 levels in the room. CO2 levels were 100 to 200 ppm higher when the door was fully closed. 14/ 

Another important feature of this CO2 monitor is that it has upgradable firmware so when new features are made available or bug fixes are required, a firmware update can easily be downloaded and applied. 15/
The web portal will notify you that a new firmware version is available and a click of a button in the portal will automatically update it for you. Several new features have been added since I purchased the device. 16/
The Model C is powered by a USB-C connector but it also contains a battery. With WiFi disabled, my device lasted more than 16 hours before I stopped testing, which was longer than the amount of memory available to store data locally. 17/
With WiFi enabled, the battery still lasted 10 hours so Andre is being very conservative with his advertised battery life estimates of 12 hours with WiFi disabled. 18/
You can also set an alert threshold to e-mail you or create an audible sound if the CO2 monitor detects CO2 levels above that configured level. It has been fascinating to measure CO2 levels in various places. This monitor's CO2 sensors are extremely sensitive. 19/
Despite the sensor being in on a different floor in the house, away from where people were physically located, CO2 levels in this distant room would drop further every time another person left the house with less people remaining to exhale CO2 in the home. 20/
When everyone was away at work or school CO2 levels would drop to almost outside levels, but on weekends if the weather was not great so everyone stayed inside, CO2 levels never dropped below 600 ppm. 21/
@IndianaTux has created a great CO2 monitor at a more affordable price and is very responsive to questions and feedback. He even implemented some of the suggestions I had made, which came in the form of a firmware update. 22/
The monitor also handily calculates the rebreathed fraction of air (RFA) which is how much air you would be inhaling that comes out of other people in an indoor space. It also converts RFA to how many litres per hour of other people's breath you are inhaling. 23/
You can learn more about how to do those calculations yourself using this spreadsheet shared air calculator ( docs.google.com/spreadsheets/d… ). When the CO2 levels are at 975 ppm you can see that every breath people take in that room contains 1.5% of the collective breath of others. 24/
This may not sound like much except the typical amount of air inhaled per day means you are breathing in 6 litres every hour of other people's breath. If ventilation was horrible and CO2 levels were 3152 ppm that would be 30 litres every hour of other people's breath. 25/ 
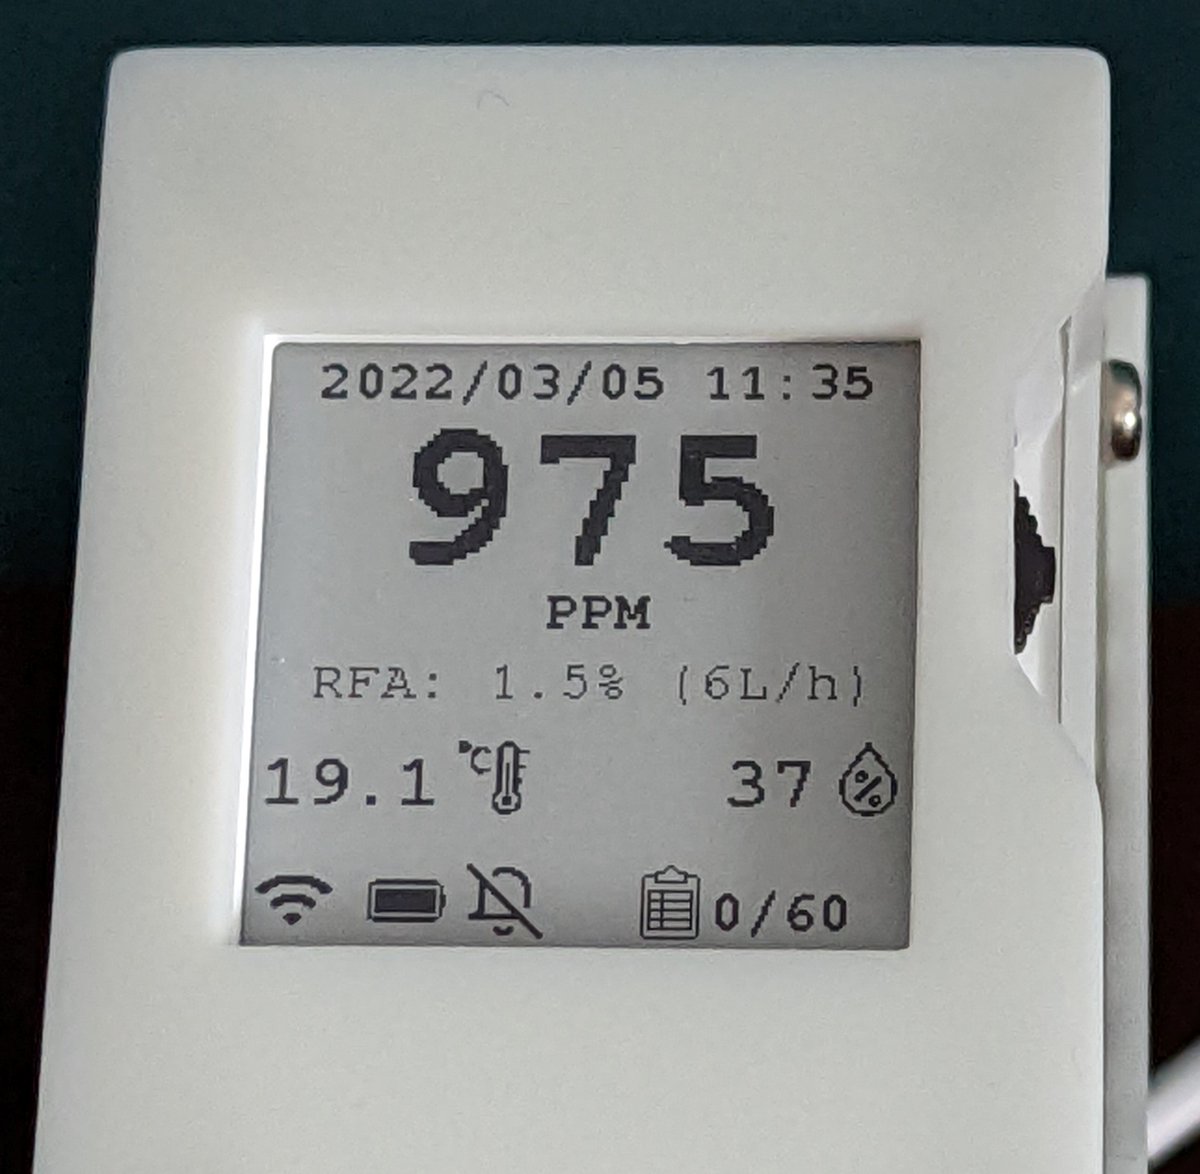
No wonder so many people get infected indoors with poor or no ventilation breathing in that much aerosols from someone who might be infected in the room now or who had been there an hour ago and already left. 26/
The Model D which I did not test is for people who are not interested in sending data to the cloud. It is slightly cheaper, has more local storage capability, and a longer battery life. The 5 days worth of local data storage is also downloadable. 27/
FYI, in case you weren't aware, there is a great Canadian made CO2 monitor ( co2.click ) using a Swiss dual-beam NDIR sensor, please see the review in this thread @SabiVM @nilikm @KashPrime @imgrund @MamaToronto @CPita3 @TRyanGregory @fitterhappierAJ @Don_Milton.28/
• • •
Missing some Tweet in this thread? You can try to
force a refresh


