We being the MMWR Week 19 2022 update with Non-Natural Cause Deaths.
Pharma trolls and Covid panic aficionados this is the tally of young people you murdered (so far 86,800). This is different from an unstoppable virus doing its work. Sleep well.
[1/10]
Pharma trolls and Covid panic aficionados this is the tally of young people you murdered (so far 86,800). This is different from an unstoppable virus doing its work. Sleep well.
[1/10]

77 weeks now of elevated R00-R99 death categorization flux. Disappointingly, this last week, we equaled the old peak, so this is not going down as I had hoped.
As we saw yesterday, this curve moves commensurately with both excess death and excess cancer death.
[2/10]
As we saw yesterday, this curve moves commensurately with both excess death and excess cancer death.
[2/10]

Will we see a repeat of last years off-season flu resurgence (the '???'). I suspect we will.
As one can see, there is no longer an 'Omicron' - that lie is busted. There is a background diverse array of proto-Covid descendants bearing the BA.X series moniker.
[3/10]
As one can see, there is no longer an 'Omicron' - that lie is busted. There is a background diverse array of proto-Covid descendants bearing the BA.X series moniker.
[3/10]

Now for our three ICD-10 watch-list death categories.
We begin with excess Cerebrovascular deaths.
A 4.4 sigma event compared to a 2-sigma Covid context. This bears further watching - because it should not be occurring as much now.
[4/10]
We begin with excess Cerebrovascular deaths.
A 4.4 sigma event compared to a 2-sigma Covid context. This bears further watching - because it should not be occurring as much now.
[4/10]

Second, is Nephritis and nephrotic syndrome deaths. A 3.8 sigma even - and also bears watching.
[5/10]
[5/10]

The 3rd canary in the coal mine (aside from cerebrovascular & nephritis deaths), Malignant Neoplasms.
As we mentioned yesterday, we used an older more conservative lag curve just to make sure we don't over-blow this increase.
Still at 8.7 sigma - last week was at 8.8.
[6/10]
As we mentioned yesterday, we used an older more conservative lag curve just to make sure we don't over-blow this increase.
Still at 8.7 sigma - last week was at 8.8.
[6/10]

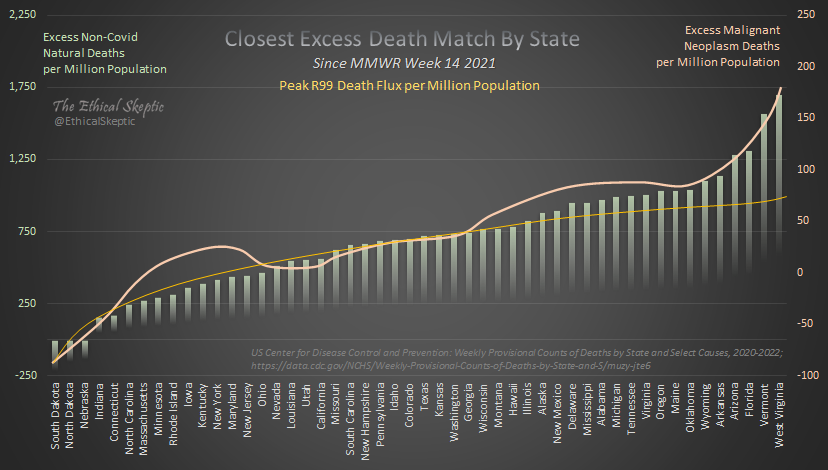
As we observed yesterday, these excess Cancer deaths vary tightly with Non-Covid Natural Cause Excess Deaths, by US state.
But they constitute only 11% of that excess in terms of magnitude. In other words, something else besides missed cancer screenings is causing this.
[7/10]
But they constitute only 11% of that excess in terms of magnitude. In other words, something else besides missed cancer screenings is causing this.
[7/10]
In all, the impetus behind this Non-Covid Natural Cause Excess Death (remember murders, accidents, overdoses are removed) - has produced 280,100 anomalous deaths since 2021 MMWR Wk 14.
This is roughly equivalent to last week because of the more aggressive lag curve.
[8/10]
This is roughly equivalent to last week because of the more aggressive lag curve.
[8/10]

In All Cause Excess Mortality summary, Lack of Treatment deaths and Cerebro/Cancer/Kidney/Heart deaths both continue their hot pace.
This is making troll and panic pusher alike (those who even bother to look) sweat bullets. You shall know them by their fruits.
[9/10]
This is making troll and panic pusher alike (those who even bother to look) sweat bullets. You shall know them by their fruits.
[9/10]

In terms of Full Covid Accountability.
Panic Tally = 829,480 deaths from lack of treatment, disruption, and some other unknown factor (the three lighter colored spheres below). ...and growing.
American Civil War = 618,200 deaths.
[10/10]
Panic Tally = 829,480 deaths from lack of treatment, disruption, and some other unknown factor (the three lighter colored spheres below). ...and growing.
American Civil War = 618,200 deaths.
[10/10]

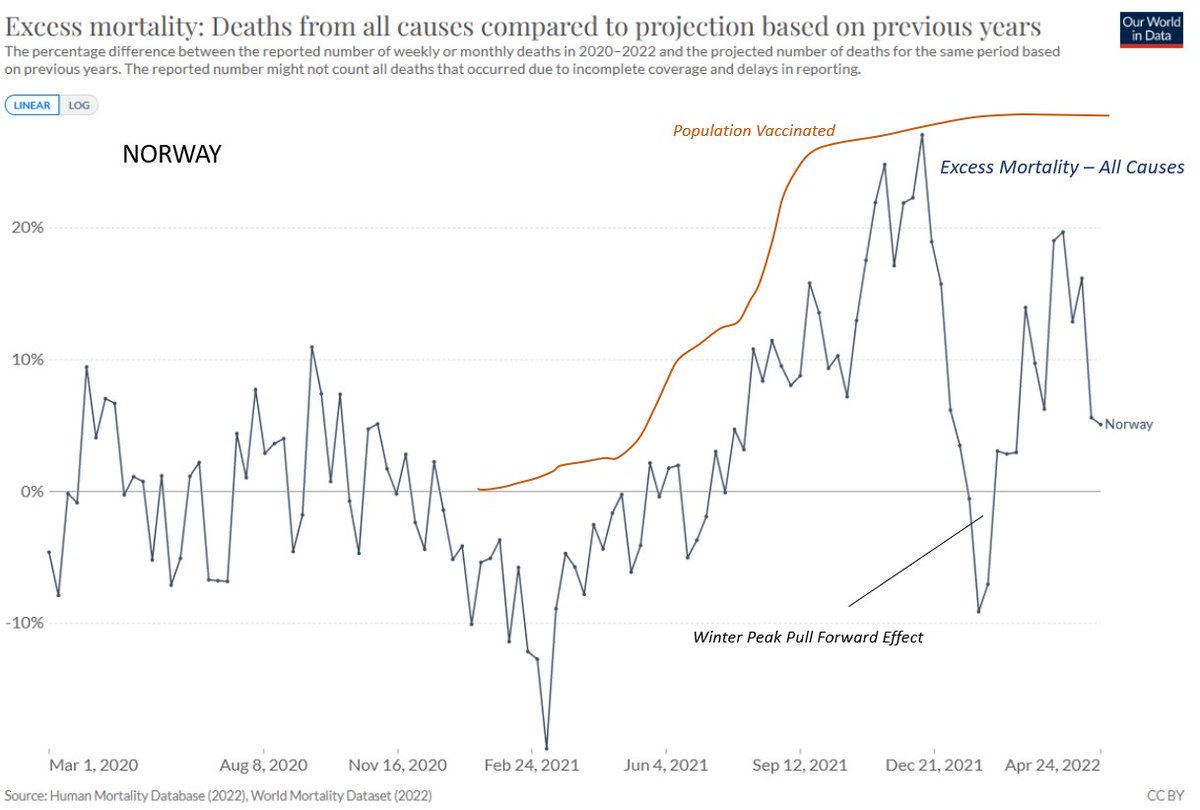
Regarding those who say "Why isn't this happening in European countries" (a rhetorical statement, not really a question)
1. Have them run the models correctly, not just for All Cause Excess Mortality, and
2. Even running All Cause Excess Mortality - Europe is WORSE...
[11/10]
1. Have them run the models correctly, not just for All Cause Excess Mortality, and
2. Even running All Cause Excess Mortality - Europe is WORSE...
[11/10]


• • •
Missing some Tweet in this thread? You can try to
force a refresh