We now have enough co-circulation of Omicron sub-lineages BA.4, BA.5 and BA.2.12.1 in the US to make an assessment of relative fitness between these viruses. 1/12
Pango lineages BA.4 and BA.5, corresponding to @nextstrain clades 22A and 22B, were first described in South Africa by @Tuliodna et al and possess key spike mutations L452R and F486V. 2/12
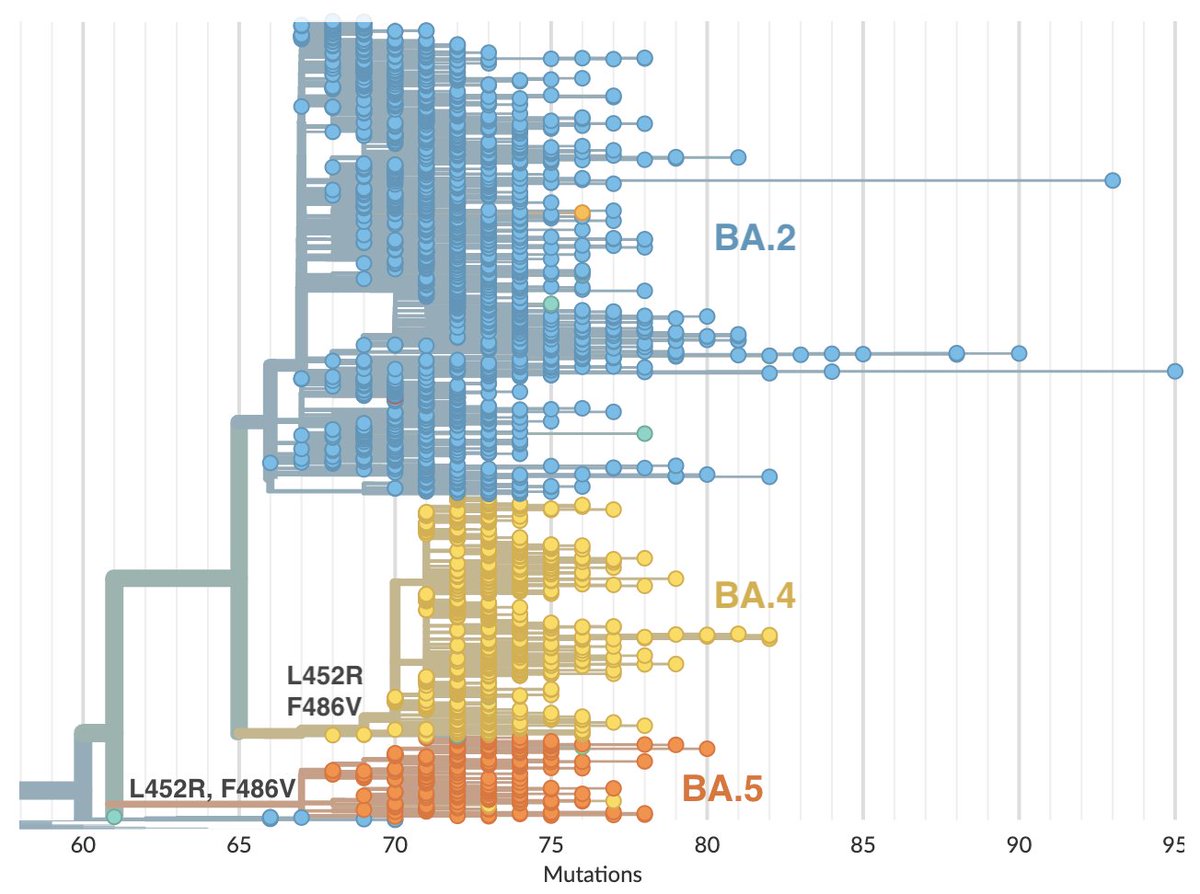
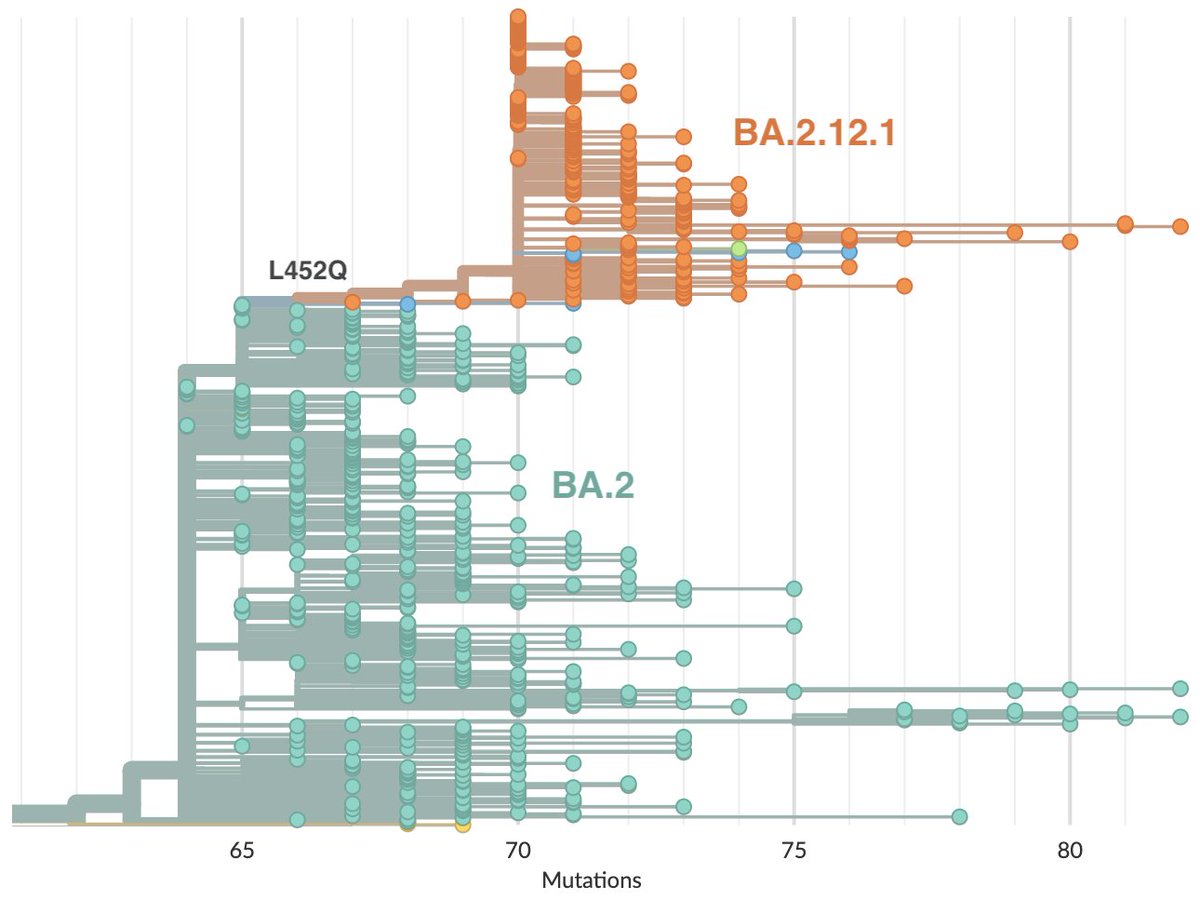
Initial spread of Pango lineage BA.2.12.1, corresponding to @nextstrain clade 22C, centered on New York and the Northeast, but has since spread more widely in the US and elsewhere. It possesses key spike mutation L452Q. 3/12
Previously, we could observe relative fitness based on frequency increase in South Africa of BA.4 and BA.5 and separately, relative fitness in the US of BA.2.12.1. But comparisons across geographies of frequency growth rate are not fully reliable. 4/12
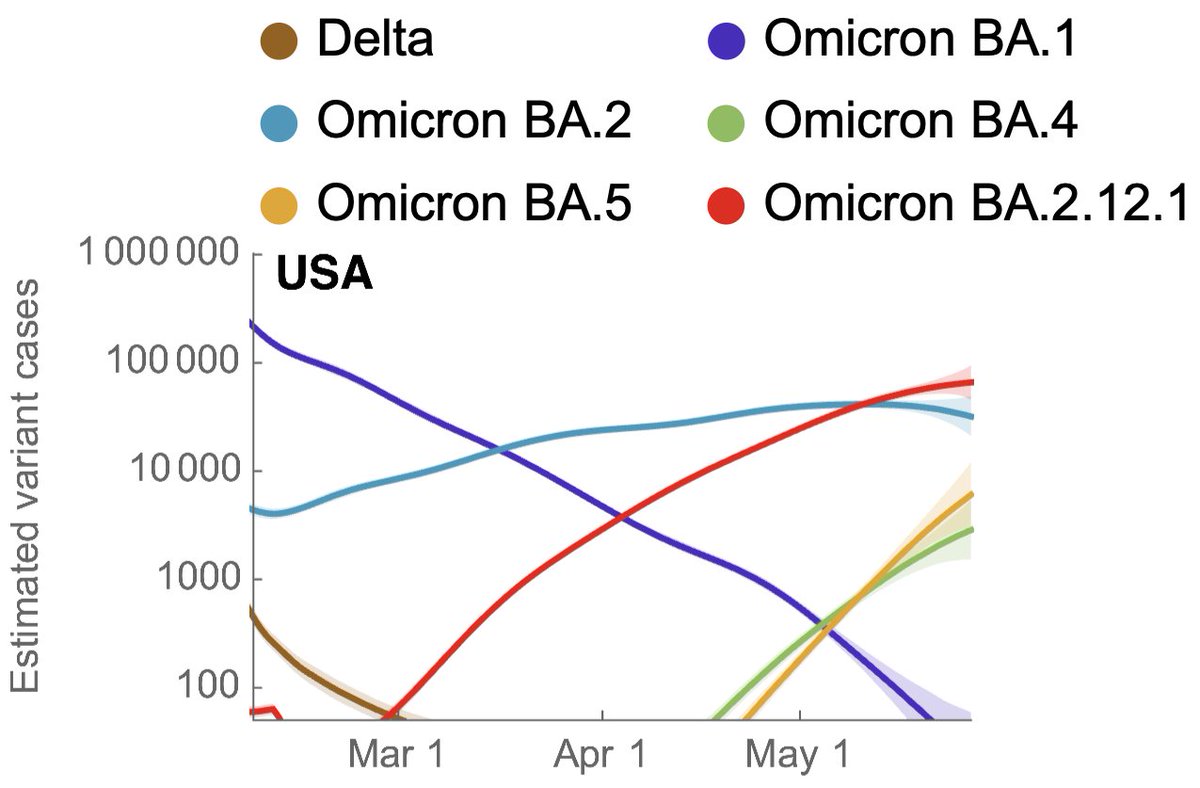
Ideally, we want to compare frequency growth rate in the same geography. Focusing on the US, we see that BA.2.12.1 currently has a logistic growth rate of 0.05 per day, while BA.4 and BA.5 have logistic growth rates of 0.09 and 0.14 per day. 5/12
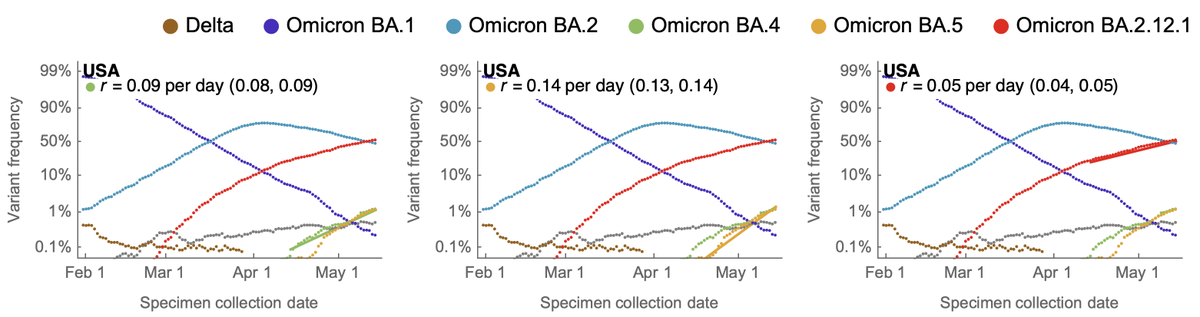
This suggests BA.4 and BA.5 are fitter than BA.2.12.1 as one might expect given the additional spike F486V mutation (plus mutations elsewhere in the genome), and that we expect BA.4 and BA.5 to continue to increase in frequency on the background of BA.2 and BA.2.12.1. 6/12
We can assess variant-specific Rt using method developed by @marlinfiggins (bedford.io/papers/figgins…), where we observe current Rt for BA.2.12.1 of ~1.0, compared to Rt of BA.4 of ~1.2 and BA.5 of ~1.5. 7/12
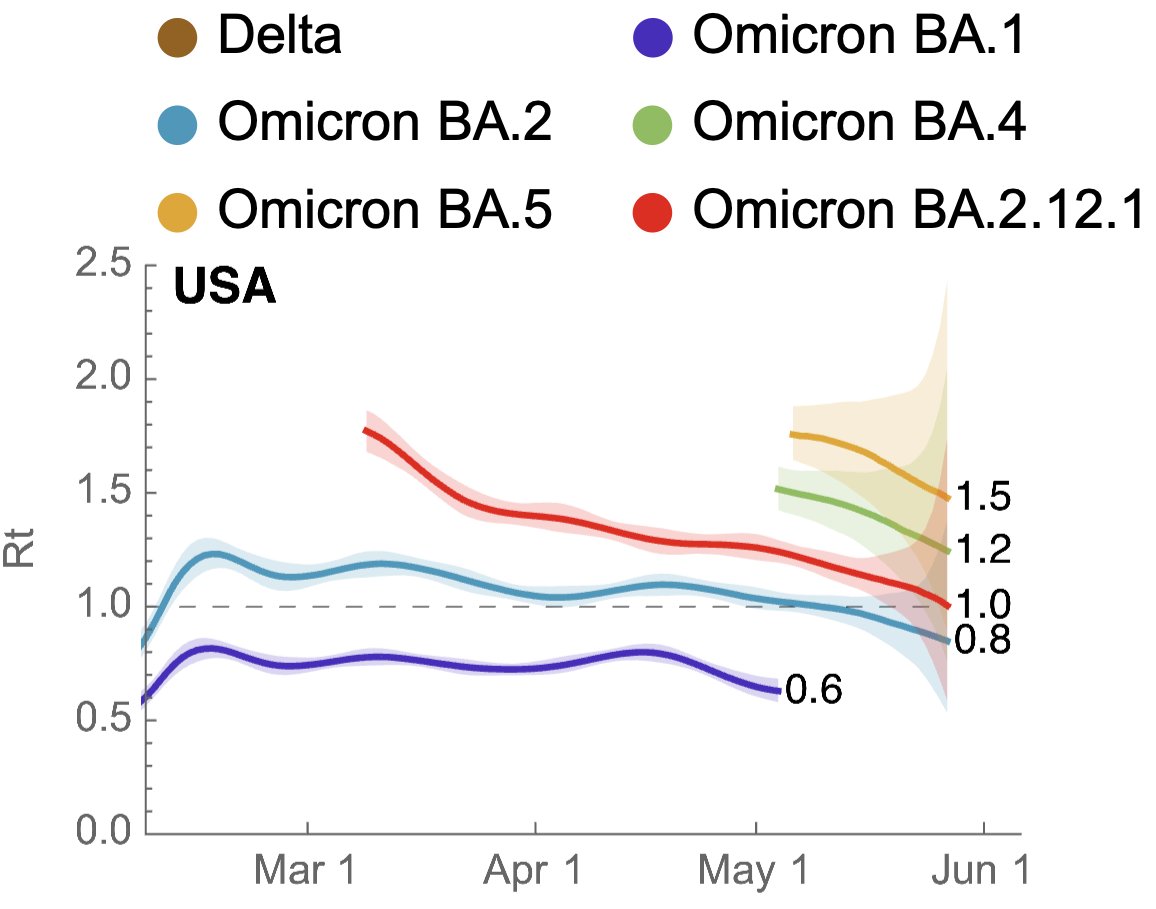
This along with current frequency of BA.2.12.1 indicates that rise in current case counts can be at least in part attributed to BA.2.12.1 epidemic and we additionally see growing epidemics of BA.4 and BA.5 in absolute case counts. 8/12
This pattern is mirrored across other countries where we see growing epidemics of BA.2.12.1, BA.4 and BA.5, particularly in Portugal where BA.5 got an early start and is beginning to push cases past BA.2 levels. 9/12
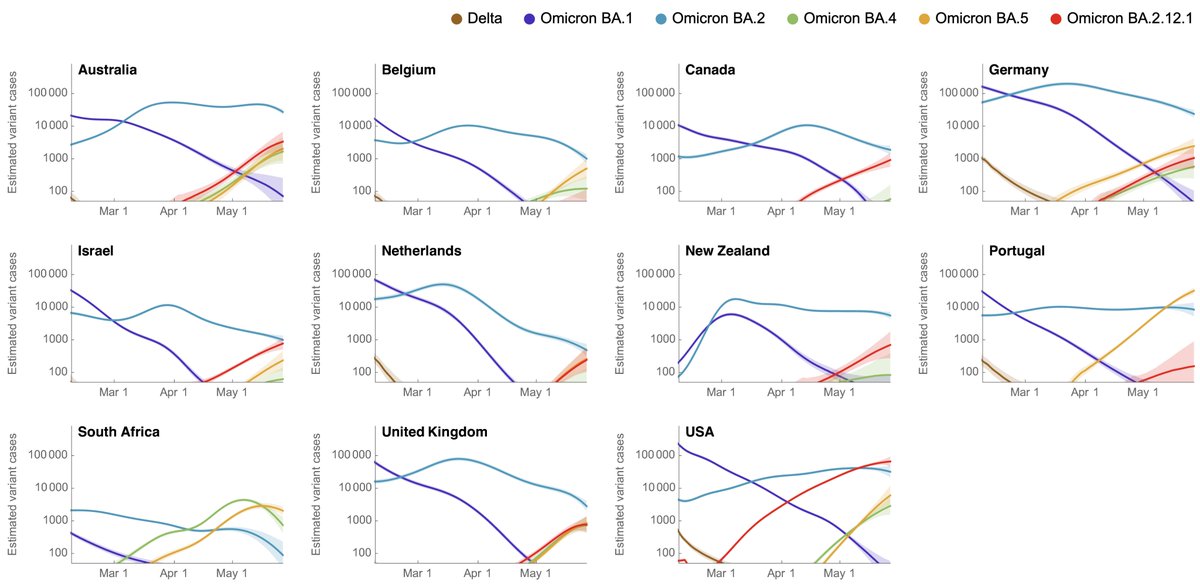
There is a notable drop in neutralization titer against BA.4 and BA.5 viruses in boosted individuals and individuals with BA.1 breakthrough infections (figure from Qian Wang, David Ho and colleagues biorxiv.org/content/10.110…). 11/12
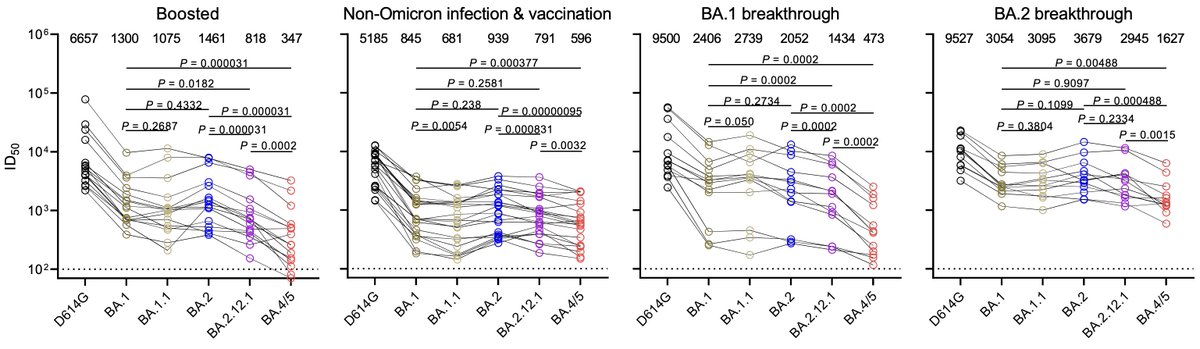
Thus, we expect at least some portion of the BA.4 / BA.5 epidemics to be driven by increased vaccine breakthrough and increased reinfection relative to current BA.2 circulation. 12/12
• • •
Missing some Tweet in this thread? You can try to
force a refresh
Non-travel related monkeypox cases were announced by @UKHSA just 10 days ago on May 14 and first viral genome shared by @irj_pt 5 days later on May 19. It's remarkable how far pathogen genomic sequencing has come, in part spurred by the pandemic. 1/9
There are now over 300 confirmed and suspected cases globally and at least 15 viral genome sequences shared publicly. The extent and trajectory of the outbreak is still incredibly hazy. Here, I wanted to give a word of caution on genomic epidemiology of monkeypox. 2/9
Thanks to data sharing by @irj_pt, @unibw_m, @CDCgov, @KU_Leuven, we can see relationships among sequenced viruses at nextstrain.org/monkeypox, where viruses from the current outbreak (in yellow) are nearly identical to one another suggesting a single introduction event. 3/9
We're now starting to see the evolution of new potentially impactful sublineages of Omicron with particular focus on mutations at spike residue 452. Here, I'd like to highlight lineages B.2.12.1 in New York, as well as BA.4 and BA.5 in South Africa. 1/17
Stepping back, Omicron emerged as three distinct lineages BA.1, BA.2 and BA.3 and despite the head start of BA.1, we've seen BA.2 overtake BA.1 across the world over the course of January to April. 2/17
Variant "fitness" will depend on intrinsic transmissibility and escape from existing population immunity. The first tranche of variants (Alpha, Delta, etc...) largely spread due to increased intrinsic transmissibility, while Omicron spread primarily due to immune escape. 3/17
Today, I presented to @US_FDA VRBPAC with an overview of SARS-CoV-2 evolution up to this point and a brief perspective for what to expect going forward. Slides are here: bedford.io/talks/sars-cov… and my slot in the full recording is viewable here: . 1/13
My main point was really how fast evolution has been proceeding. We see that SARS-CoV-2 variants have (1) displaced existing genetic diversity and (2) accumulated amino acid changes in the relevant domain much faster than seen in the fastest seasonal flu subtype H3N2. 2/13
It seems fully reasonable to expect continued rapid evolution as the virus seeks to escape from widespread population immunity acquired through infection and vaccination. 3/13
Omicron viruses can be divided into two major groups, referred to as PANGO lineages BA.1 and BA.2 or @nextstrain clades 21K and 21L. The vast majority of globally sequenced Omicron have been 21K (~630k) compared a small minority of 21L (~18k), but 21L is gaining ground. 1/15
Omicron clades 21K and 21L differ at ~40 amino acid sites, which is substantial in the context of SARS-CoV-2 evolution. 2/15
For comparison Alpha, Beta and Gamma are each about as divergent from each other in terms of amino acid changes across the genome as Omicron 21K and 21L are from each other. Figure from @nextstrain (nextstrain.org/ncov/gisaid/gl…). 3/15
Case counts for the US appear to have peaked at a 7-day average of 806k on Jan 14. Omicron grew from approximately 35k daily cases on Dec 14 to ~800k daily cases in ~4 weeks. 1/9
Looking at cases per 100k population per day across states, downturns are clear in NY, NJ, MA, FL, etc..., but many states are not yet at peak case loads. 2/9
With Omicron, case counts in the US and many other countries have skyrocketed. The US 7-day average is now ~680k cases per day, or 0.2% of the population recorded as confirmed cases each day. 1/15
However, a large fraction of infections, symptomatic and otherwise, don't end up reported as cases due to lack of testing (either the individual doesn't seek testing or testing is desired but not readily found). 2/15
Historically, I have assumed that around 30% of infections in the US are reported as cases. This number was derived from seroprevalence and modeling estimates from sites like (no longer updated) covid19-projections.com. 3/15