1/15 Is the US housing bubble 2.0 about to "pop"? Well, first, we'll note that applications for home purchases are among the best leading indicators for the real estate market - i.e., potential buyers try to get pre-approved for a mortgage, then lock in a rate, and then start...
2/15... house hunting. And, the MBA's Purchase Mortgage Applications Index has dropped to levels not seen since the depths of the COVID lockdowns in Mar. 2020 - while index was up +8.1% this week, it was down -15.6% from a yr ago, which follows last week's 6/3/22 -20.6% YoY fall.
3/15 So, with the MBA Purchase Mortgage Applications Index now at the lows of late 2018, some history on the state of play in 2018 is warranted. That is, we note by Nov 2018 the Fed had been hiking rates for yrs (very slowly), QT was ongoing, & mortgage rates were >5%, which...
4/15... proved enough to shake up the housing market. What happened? Well, home sales slowed, home prices fell in many markets, and stocks sold off (hard). Moreover, in Nov. 2018, inflation was below the Fed's target; thus, w/ Trump pushing Powell to be more accommodative to...
5/15... boost the stock market, the Fed signaled around Dec. 2018 its intention to ease policy, and instantly mortgage rates collapsed, which sent home sales & home prices WAY higher. Yet, today, w/ the Fed's sole purpose to fight inflation w/ the blessing of the White House,...
6/15... J Powell & Co aren't going to stop home prices from imploding n-term. And, given the Fed is on record targeting demand destruction to bring down inflation, and real estate is BY FAR the largest holding (by wealth) of the majority of Americans (i.e., 55% of...
7/15... the wealth of the bottom 90%), it seems this is EXACTLEY where the Fed will focus its demand destruction (i.e., the US housing market).
8/15 Thusly, w/ the 30yr fixed mortgage rate (w/ 20% down) rising >6% this week, or the highest since 2009, we note that using a simple mortgage calculator & considering the 52-week low for the 30yr fixed mortgage is 2.8%, the price of a $400K house at a 30yr fixed 2.8% rate...
9/15... would have to drop to $272.5K (-32%) at today's 6.03% rate for the payment to stay flat. #housingcrashmortgagecalculator.org. And, as would be expected, it turns out sky-high home prices to be funded w/ near-recent record mortgage rates, not to mention fears around...
10/15... recession, & falling crypto/stock prices, combined, are a NASTY mix for homebuyers. That is, the number of people saying now is a "bad time to buy" a home jumped to 79% in May, a record high in the data going back to 2010, according to Fannie Mae. In short, THIS IS BAD!
11/15 It gets worse however. That is, in the most recent week, applications for mortgages to refinance an existing mortgage dropped -76% YoY, after being down -75% YoY last week.
12/15 In fact, w/ mortgage rates >6%, among the only reasons one would seem to need to refinance would be to extract cash from the home via a cash-out refi. Yet, according to the AEI Housing Center, which tracks mortgage rates by the number of rate locks, in May this seg. of...
13/15... the market (i.e., no-cash-out refi applications) imploded -92% from a yr ago. In short, cash-out refis provide A LOT of money for homeowners to spend on things like: (a) other homes, (b) home improvements, (c) cars, (d) credit card debt, (e) clothing/electronics,...
14/15... etc. In short, not only is the plunge in cash-out refis bad for the housing market, but it's bad for the broader US economy (i.e., leading indicator). And, w/ the spike in mortgage rates & subsequent -92% collapse in no-cash-out refi mortgage applications, this form...
15/15... of stimulus is OVER. The housing bubble is popping. Few understand this.
• • •
Missing some Tweet in this thread? You can try to
force a refresh
1/9 The bull case seems to be there there's no housing inventory left. However, it's important to remember that "inventory" in housing refers to both homes listed for sale & vacant homes that owners want to EVENTUALLY sell b/c they've already moved into a new house, but...
2/9... haven't as they want to ride the surge in home prices "all the way to the top". And, this dynamic has been in full swing over the past 24 months as home prices spiked - i.e., people brought a new home, moved in thus moving out of the old home, yet didn't sell that old...
3/9... home, waiting for the big price appreciation that was "sure" to follow. Yet, w/ prices now falling, it is becoming clear that those vacant homes are beginning to hit the market in DROVES. That is, in May, active listings JUMPED +26% from April, and are now up +8% from a...
1/5 At @GLJ_Research we have long argued (I believe we were among the first to publicly argue this) our belief that $TSLA was not collecting the millions of miles of data it claimed & many thought made its autonomous drive/FSD tech better than everyone else. And, largely...
2/5... validating our views was the revelation in the new NYT/Hulu documentary, by a former Tesla software engineer, that the cars’ hardware & software did not have the capability to collect the data that many claimed they did. That is, we have questioned for yrs "Where are...
3/5... the servers?" "How much bandwidth is needed?" "What would that cost?", but were ALWAYS dismissed as angry bears, & told "Tesla has an insurmountable FSD lead b/c of data collection". We now know, as we have said all along at @GLJ_Research, this is simply not true &...
Importantly, as noted by @WallStCynic, as it relates to $TSLA: “was the revelation in the new NYT/Hulu documentary, by the former Tesla software engineer, that the cars’ hardware & software did not have the capability to collect the data that many claimed they did.” @nealboudette
@WallStCynic also noted: “Many of us questioned for yrs ‘Where are the servers?’ ‘How much bandwidth is needed?’ ‘What would that cost?’, but were dismissed as angry bears, & told ‘Tesla has an insurmountable FSD lead b/c of data collection’; this is simply not true & never was.”
The software engineer in the NYT/Hulu documentary was clear that there was no infrastructure to collect/store all that data at $TSLA as claimed by @CathieDWood, @GerberKawasaki, @DivesTech, @munster_gene, etc. This has been suspected for yrs by @GLJ_Research & finally confirmed.
@MartinViecha question. It seems the entire TSLA EU backlog has literally disappeared, overnight, even though the Shanghai plant is now shut indefinitely. That is, one can get a MY in across virtually all EU countries in May (vs. Aug. yesterday), which means w/ shipping times,...
... there is no backlog left. Barring the change in your definition of a delivery in 1Q22 meaning, using the prior definition, you actually produced more cars than you sold, how can the EU backlog disappear overnight? Is the answer your China sales numbers have fallen through...
... the floor and, thus, you have excess capacity, suddenly, as... using the "definition" of deliveries in each quarterly delivery/production report dating back to 2Q17, you actually made more cars than you sold in 1Q22? Or, is the answer you're not sold out as many claim, and...
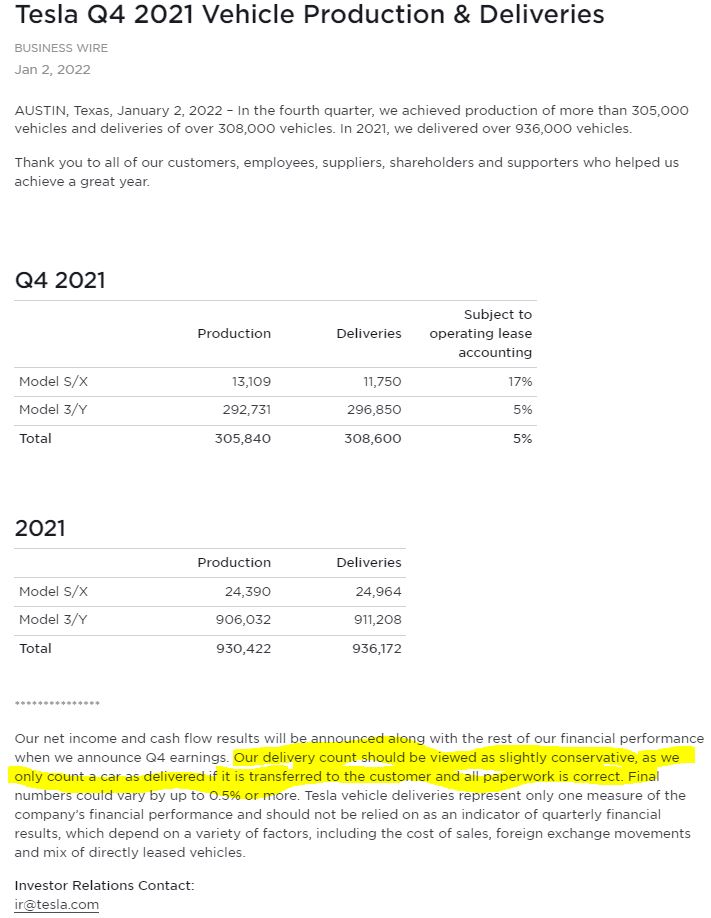
Hey @MartinViecha, can you help us understand why you took this language out of your 1Q22 delivery disclosure: "we only count a car as delivered if it is transferred to the customer and all paperwork is correct"? Are you now including cars as delivered that haven't been...
... transferred, and/or don't have proper paperwork? Why is that language in prior delivery report disclosures, BUT NOT in your 1Q22 delivery disclosure? @DivesTech, @p_ferragu, @TroyTeslike, @GerberKawasaki... can you help out here? IR has never answered a GLJ Research question.
The disclosure that TSLA has omitted in 1Q22 noted above has been in every delivery report dating back to 2Q17's 7/7/17 disclosure. So this is the first time that language has been omitted in ~5yrs. Can you tell us what the equivalent deliveries are including that disclosure?...
1/5 The current run-rate is a little over 300k/quarter = a hair over 1M/year.
10 years = 40 quarters.
If they sell 100k/quarter more each quarter than the previous quarter for each of the next 40 quarters, in 40 quarters (10 years) they're selling 40 x 100k = 4M/quarter more...
So continual sequential quarterly growth of 100K gets them to around 17M in 10 years. Current sequential growth is only averaging, what, around 30K? That would get them to around 30k x 40 = 1.2M/quarter more in 10 years = 4.8M plus the current...
3/5... 1.2M = 6M year (and would require 8 more factories at 500K each). (Of course there's no way they'll have demand for 6M/year without MANY more models.) And 6M/year is the size of GM, with its $62B market cap. Take that 10 years from now and discount it back at 15% a...