Ryan Burge 📊 Profile picture
Jun 27, 2022 5 tweets 3 min read Read on X
New from me @Religion_Public - who are those who were cheering the Dobbs decision last week?

First - it's important to point out that 1/5 Americans want to make abortion illegal in the United States.

But what are their demographics, religion, and ideology?

THREAD (1/5). Image
I was pretty shocked to learn that the racial composition of those opposed to abortion looks almost exactly like the racial composition of the United States overall.

White folks are not overrepresented in the anti-abortion subset of the population. Image
In terms of religion, the gaps aren't as large as many people would assume.

Catholics are 18% of America and 20% of the anti-abortion subset.

Protestants are 12 points different (46% vs. 34%), while the nones are 21% vs 34%. But no other differences to speak of. Image
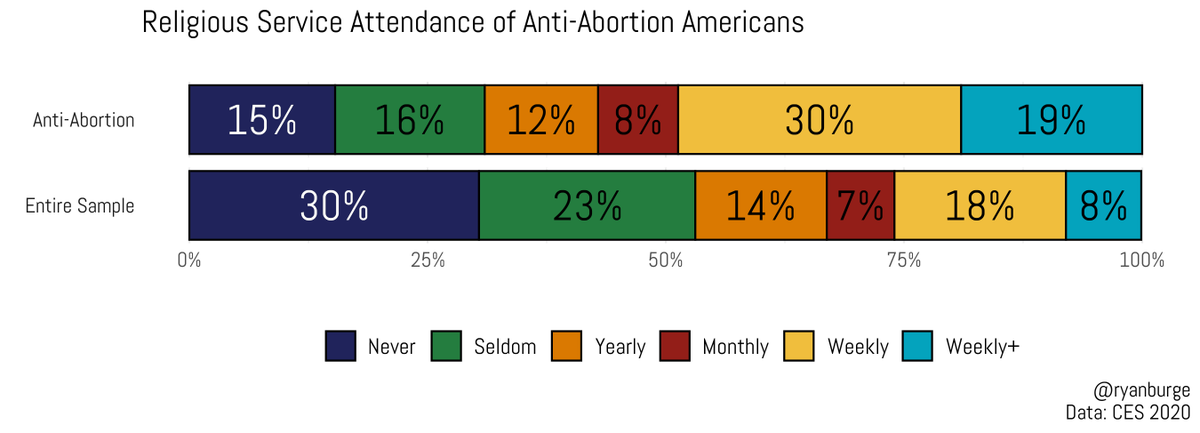
However, when it comes to church attendance that disparity between the two groups grows substantially.

49% of anti-abortion people attend church weekly or more. It's just a quarter of the gen pop.

It's notable that 31% of anti-abortion folks attend less than yearly, tho. Image
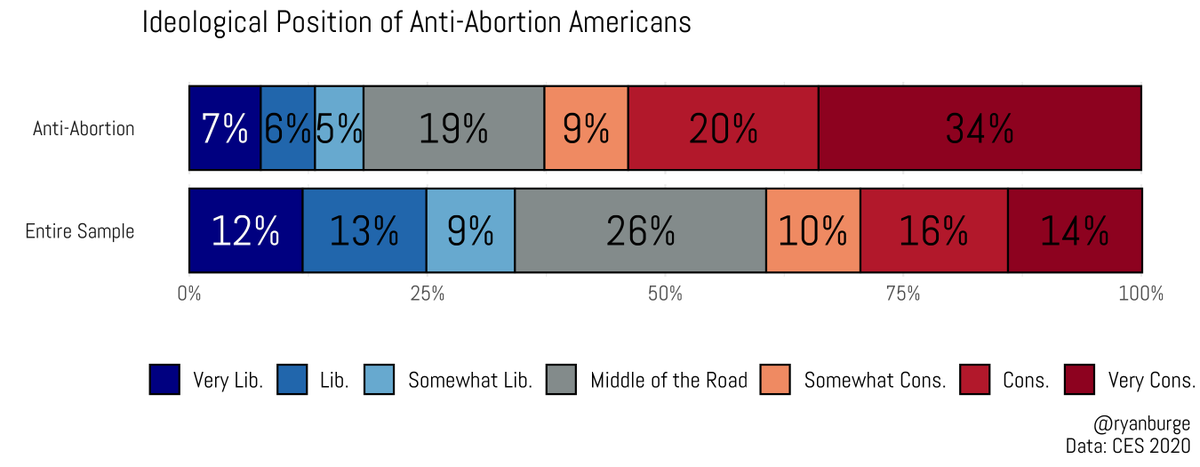
Finally, the political ideology of anti-abortion Americans is obviously more conservative. 63% of them ID as conservative vs. 40% of the gen pop.

However, 18% of anti-abortion people ID as liberal - much higher than I would have guessed. Image
• • •

Missing some Tweet in this thread? You can try to force a refresh
 

Keep Current with Ryan Burge 📊

Ryan Burge 📊 Profile picture

Stay in touch and get notified when new unrolls are available from this author!

Read all threads

This Thread may be Removed Anytime!

PDF

Twitter may remove this content at anytime! Save it as PDF for later use!

Try unrolling a thread yourself!

how to unroll video
  1. Follow @ThreadReaderApp to mention us!

  2. From a Twitter thread mention us with a keyword "unroll"
@threadreaderapp unroll

Practice here first or read more on our help page!

More from @ryanburge

Jan 28
The finding that young women are becoming a lot more liberal while young men are becoming a lot more conservative DOES NOT REPLICATE in the Cooperative Election Study.

In fact, the two lines have run in almost perfect parallel for the last 15 years.
Image
Great points from @dcoxpolls here.

It's nearly impossible to perfectly replicate a finding across two different surveys.

Face to face vs online, question wording, response options are never consistent across two instruments.

@dcoxpolls This is an adjacent measure:

It's % Democrats minus % Republicans. Again, 18-29 year olds by gender.

Women are more Democratic than men.

The difference for women is D+22, for men it's D+13.

But, no huge shifts on this metric in recent years, either. Image
Read 4 tweets
Sep 4, 2023
If there's a graph that lives rent free in my head right now, it's this one.

For decades, there was a positive relationship between religious attendance and interpersonal trust.

More attendance <---> More trust.

That relationship flipped in the last decade.

🧵 Image
The American public has really never been that trusting.

Even in the early 1970s the share who said, "you can't be too careful" in trusting other people was higher than those who said people "can be trusted."

But the gap was widened.

1970s: 51% vs 45%
2021: 65% vs 26% Image
And here's something that I found interesting.

For Republicans in the 1970s, there were more trusters than distrusters.

That wasn't the case for Democrats - they've always been more skeptical.

In 2021, Trust vs No Trust:
Republicans: 28% vs 65%
Democrats: 31% vs 57% Image
Read 7 tweets
Jul 17, 2023
In the last fifteen years, American religion has become less about things like regular corporate worship and more about using religion as a cultural and political marker.

It's Christians who don't go to church fighting for "traditional" values.

🧵

graphsaboutreligion.com/p/religion-as-…
It's clear as day in the religious attendance of those who self-identify as evangelical/born-again.

16% of evangelicals attended never/seldom in 2008.

It's 27% in 2022.

Weekly attendance was 59% in 2008.

Now, it's 49%.

Weekly+ attendance is down 11 pts since 2008. Image
This is clearly a political phenomenon.

Among never attending Democrats, 4% were evangelical in 2008. It was 5% in 2022.

Among never attending Republicans, 7% identified as evangelical in 2008. In 2022, that had risen to 18%.

It's true for Reps at every attendance level. Image
Read 6 tweets
Jun 26, 2023
Religion in the United States has become a haven for those who have done everything "right"

College degree
Middle class income
Married
Children

That's the clear and unmistakable story from the data. And it's bad for democracy and religion.

graphsaboutreligion.com/p/religion-has…
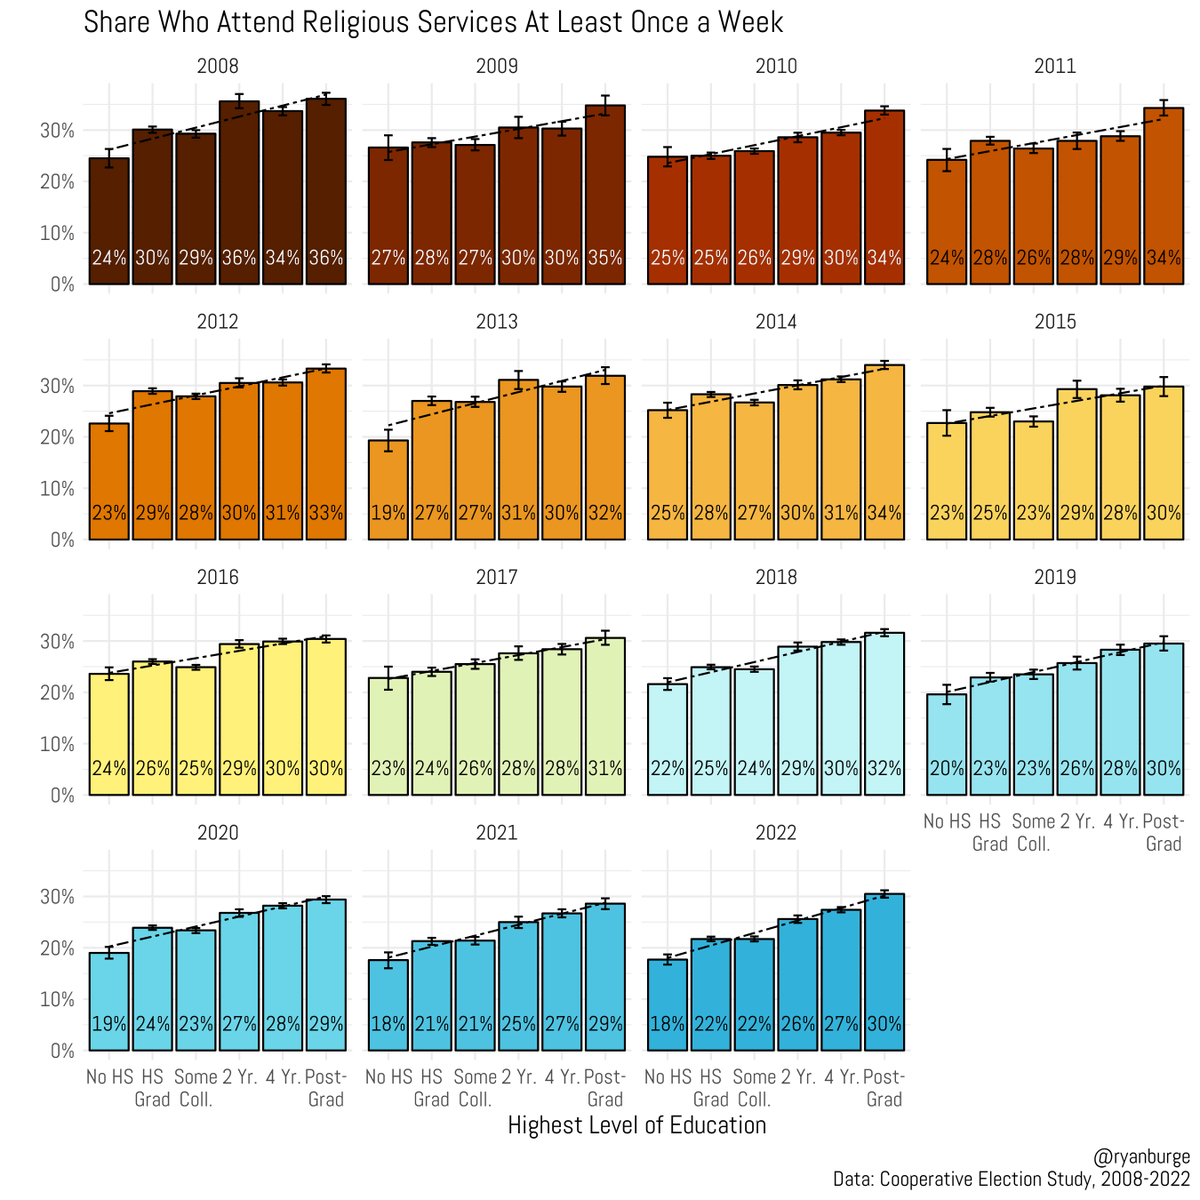
There is something very clear in the data: educated people are more likely to identify with a religious tradition.

That's true in every single wave of the CES since 2008.

The idea that religion is a refuge for the uneducated is demonstrably false.
That's all the case when looking at religious attendance. The people who are the most likely to attend weekly are those with a post-graduate degree.

The least likely? Those with a high school diploma or less.

It's consistent in all the data I've ever looked at.
Read 7 tweets
Jun 19, 2023
New post today about something that social science has long believed to be true: women are more religious than men. A raft of studies have come to that conclusion.

But maybe, among the youngest adults, that's not true anymore.

🧵 w/graphs!

graphsaboutreligion.com/p/women-are-mo…
This is the share who are nones by gender and birth year from six waves of the CES.

For folks born in the 1960s, 1980s, etc., the lines run parallel. Men are more likely to be nones.

But look at the right hand side of each: the lines are not converging. Maybe even crossing. Image
Maybe this is just the CES - let's look at the GSS.

This is share of 18-25 year olds who are nones with data going back to the 1980s.

Young men have always been more likely to be nones. Until recently.

In the 2021 GSS, 50%+ of young women are nones. It's 40% of men. Image
Read 5 tweets
Jun 8, 2023
A new post about the state of vaccine refusal in a post-COVID world.

The @GSS_NORC added a battery about parental rights to refuse the MMR vaccine, and questions about vaccine safety and necessity.

Are religious folks more vaccine skeptical?

graphsaboutreligion.com/p/is-religion-…
I don't have religious affiliation but I do have attendance.

21% of folks who never attend say that parents should have to right to refuse the MMR vaccine for their kids.

It's 30% of those who attend weekly. Image
It's really interesting to me that very few Americans disagree that, "vaccines are important for children to have." It's 3-5% of the public.

However, 38% of weekly attenders don't agree that "vaccines are safe."

It's only 29% of those who never attend. Image
Read 5 tweets

Did Thread Reader help you today?

Support us! We are indie developers!


This site is made by just two indie developers on a laptop doing marketing, support and development! Read more about the story.

Become a Premium Member ($3/month or $30/year) and get exclusive features!

Become Premium

Don't want to be a Premium member but still want to support us?

Make a small donation by buying us coffee ($5) or help with server cost ($10)

Donate via Paypal

Or Donate anonymously using crypto!

Ethereum

0xfe58350B80634f60Fa6Dc149a72b4DFbc17D341E copy

Bitcoin

3ATGMxNzCUFzxpMCHL5sWSt4DVtS8UqXpi copy

Thank you for your support!

Follow Us!

:(