Ryan Burge đź“Š Profile picture
Teach: @eiu | Research Director: @myfaithcounts | Books: The Nones & 20 Myths | Pastor: @AmericanBaptist | Graphs about Religion
Democracy’N’Peace Profile picture david Christoph Profile picture 2 subscribed
Jan 28 • 4 tweets • 2 min read
The finding that young women are becoming a lot more liberal while young men are becoming a lot more conservative DOES NOT REPLICATE in the Cooperative Election Study.

In fact, the two lines have run in almost perfect parallel for the last 15 years.
Image Great points from @dcoxpolls here.

It's nearly impossible to perfectly replicate a finding across two different surveys.

Face to face vs online, question wording, response options are never consistent across two instruments.

Sep 4, 2023 • 7 tweets • 3 min read
If there's a graph that lives rent free in my head right now, it's this one.

For decades, there was a positive relationship between religious attendance and interpersonal trust.

More attendance <---> More trust.

That relationship flipped in the last decade.

🧵 Image The American public has really never been that trusting.

Even in the early 1970s the share who said, "you can't be too careful" in trusting other people was higher than those who said people "can be trusted."

But the gap was widened.

1970s: 51% vs 45%
2021: 65% vs 26% Image
Jul 17, 2023 • 6 tweets • 3 min read
In the last fifteen years, American religion has become less about things like regular corporate worship and more about using religion as a cultural and political marker.

It's Christians who don't go to church fighting for "traditional" values.

🧵

graphsaboutreligion.com/p/religion-as-… It's clear as day in the religious attendance of those who self-identify as evangelical/born-again.

16% of evangelicals attended never/seldom in 2008.

It's 27% in 2022.

Weekly attendance was 59% in 2008.

Now, it's 49%.

Weekly+ attendance is down 11 pts since 2008. Image
Jun 26, 2023 • 7 tweets • 3 min read
Religion in the United States has become a haven for those who have done everything "right"

College degree
Middle class income
Married
Children

That's the clear and unmistakable story from the data. And it's bad for democracy and religion.

graphsaboutreligion.com/p/religion-has… There is something very clear in the data: educated people are more likely to identify with a religious tradition.

That's true in every single wave of the CES since 2008.

The idea that religion is a refuge for the uneducated is demonstrably false.
Jun 19, 2023 • 5 tweets • 2 min read
New post today about something that social science has long believed to be true: women are more religious than men. A raft of studies have come to that conclusion.

But maybe, among the youngest adults, that's not true anymore.

🧵 w/graphs!

graphsaboutreligion.com/p/women-are-mo… This is the share who are nones by gender and birth year from six waves of the CES.

For folks born in the 1960s, 1980s, etc., the lines run parallel. Men are more likely to be nones.

But look at the right hand side of each: the lines are not converging. Maybe even crossing. Image
Jun 8, 2023 • 5 tweets • 2 min read
A new post about the state of vaccine refusal in a post-COVID world.

The @GSS_NORC added a battery about parental rights to refuse the MMR vaccine, and questions about vaccine safety and necessity.

Are religious folks more vaccine skeptical?

graphsaboutreligion.com/p/is-religion-… I don't have religious affiliation but I do have attendance.

21% of folks who never attend say that parents should have to right to refuse the MMR vaccine for their kids.

It's 30% of those who attend weekly. Image
Jun 5, 2023 • 7 tweets • 3 min read
I am really proud of this post using data from @ReligionCensus about the number of houses of worship (HoW) in the United States.

I've always just assumed that there are too many churches in America. But this data made me question that.

🧵w/graphs.

graphsaboutreligion.com/p/how-many-rel… Here's the number of people per HoW in the 2020 data.

Arkansas is the most churched state: 404 people per HoW. Mississippi is not far behind: 411.

But look at Nevada: 2042 people per HoW!

And California is super high, too: 1665 people per HoW.

Huge variations by state. Image
May 31, 2023 • 5 tweets • 2 min read
New post on same-sex marriage.

Here's support over time.
1988 - 18%
2004 - 37%
2014 - 57%
2018 - 68%
2021 - 64%
2022 - 67%

Notice anything? After decades of movement to the left, support for same-sex marriage hit a ceiling and hasn't budged. Why?

🧵

graphsaboutreligion.com/p/approval-for… Here's support by religious tradition.

For every tradition except Black Protestants, opinion stopped moving in 2018.

For evangelicals, it may have even reversed itself. Below 40% now.

Mainline - 70%
B. Prot. - 58%
Catholic - 68%
Nones - 82% Image
May 28, 2023 • 4 tweets • 2 min read
Almost all of my work focuses on the relativeness oddness of religion in America, but I broadened my focus in a new post:

How does the religion of the United States compare to countries in Europe?

🧵w/some graphs!

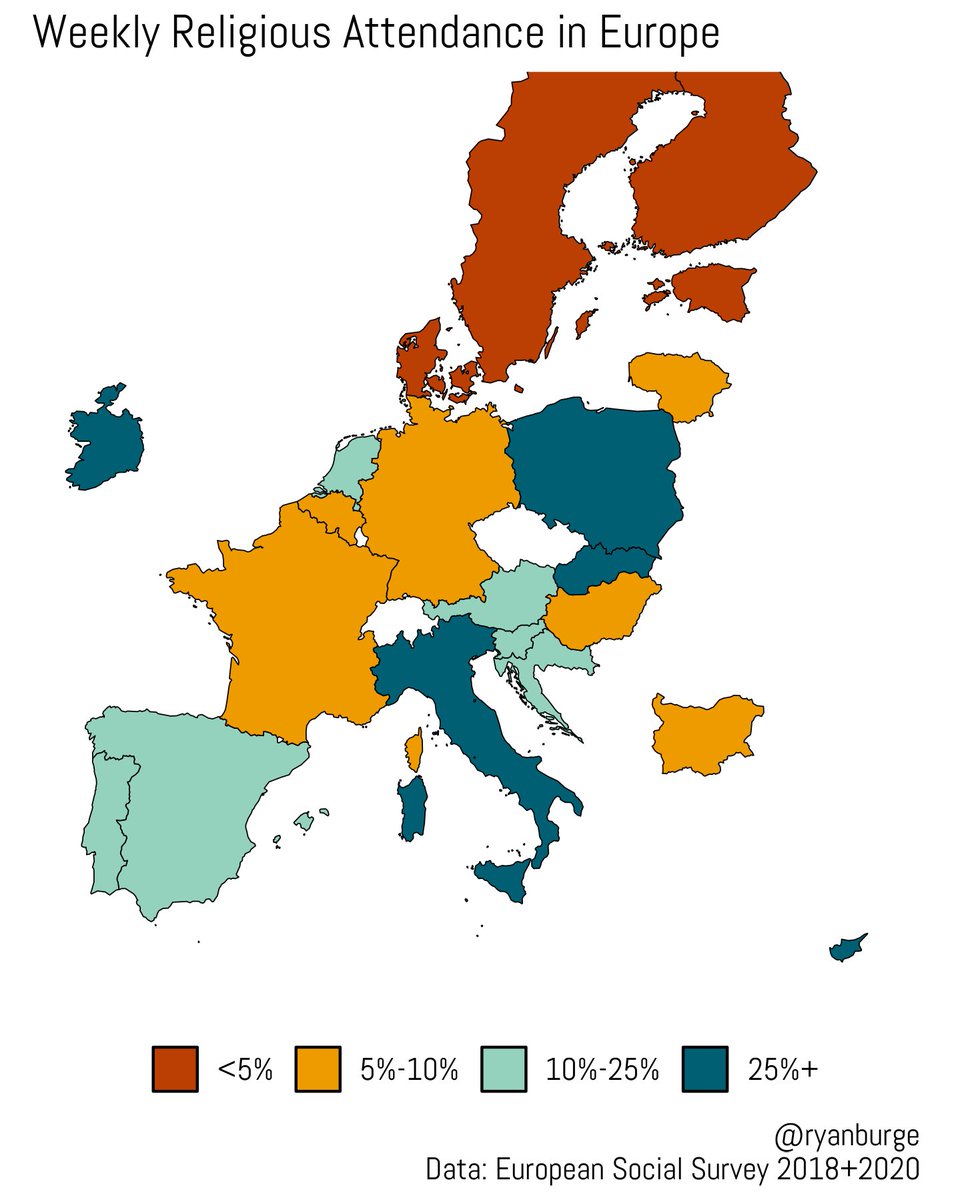
graphsaboutreligion.com/p/just-how-sec… Using the European Social Survey, I calculated weekly attendance rates for 29 European countries.

Who scores highly? Poland, Italy, Ireland and Slovakia.

44% of Poles attend weekly!

Who scores the lowest? Scandanavia.

No country there is higher than 5% weekly attendance. Image
May 21, 2023 • 6 tweets • 3 min read
A new post about a simple little thing that I felt compelled to explore in more depth: atheists just don't have many children.

Is that because they are left-leaning and progressive minded folks tend to eschew parenting?

🧵w/graphs!

graphsaboutreligion.com/p/atheists-jus… Here's the share who say that are parents broken by age. I'm comparing Latter-day Saints to atheists.

60% of 30-year-old LDS are currently parents to young children. For atheists, it’s just below 25%.

There's no age in which the majority of atheists are parents to minors. Image
May 16, 2023 • 7 tweets • 3 min read
For all the talk about how conservative Christians are the most involved in the political process, let me share some data.

Atheists engage in many political activities at 2x the rate of white evangelicals.

🧵 with graphs!

graphsaboutreligion.com/p/no-one-parti… In political activities of every type, atheists are the most active or tied for the most active.

Most likely to donate money, contact a public official, put up a political yard sign.

But also score high on attending political meetings and volunteering for a campaign. Image
May 14, 2023 • 5 tweets • 2 min read
I'm in @politico this morning, talking about how data from the @ReligionCensus, can tell us a lot about how the American political landscape has changed over the last 10 years and what that means for both parties in the 2024 election and beyond.

🧵

politico.com/news/magazine/… Here's the map that drives the discussion.

I calculated the share of each county that was part of a religious group in 2010 and 2020.

You can clearly see what religion is on the decline and where it is gaining strength.

Here are a few case studies of important counties: Image
May 13, 2023 • 6 tweets • 3 min read
So, the Southern Baptist Convention has lost 1.3 million members in the last 3 years.

In an article for @TGC, I lay out my thinking for why this is happening.

1. Trust
2. Demography
3. The Nones and the Nons

🧵w/some graphs.

thegospelcoalition.org/article/sbc-me… The first is an absolute collapse in trust, broadly, but organized religion specifically.

Every birth cohort is less trusting of religion today than they were in early adulthood.

Look at the youngest cohorts.
Trust was >40% when they were college aged.
~15% now. Image
May 10, 2023 • 5 tweets • 2 min read
The Southern Baptist Convention just released its membership statistics from 2022.

The news is bad. Very bad.

The largest single year decline ever.

A deep dive here, with some other indicators of a really bleak future.

graphsaboutreligion.com/p/the-2022-dat… The rise of the SBC through the post WW2 period is just unbelievably strong.

They were adding a million members every four years from 1946 through 1982.

Then it took 8 yrs to go from 14M to 15M.
Then 11 years to go from 15M to 16M.

Then, the wheels came off. Image
May 9, 2023 • 5 tweets • 2 min read
Everyone knows that religion is declining, but what does that actually mean for a specific denomination?

I did a deep dive into the PCUSA to provide a sense of how fast their membership has dropped and when they may cease to exist.

Short🧵.

graphsaboutreligion.com/p/what-does-de… This is the official membership of the PCUSA from it's founding in 1983 through 2022.

3.1M in 1984 -> 1.1M members in 2022.

There's not been a single year in which reported membership has done up. Image
May 7, 2023 • 5 tweets • 2 min read
The Catholic Church offers an incredibly interesting puzzle about how (and why) religion has changed so dramatically over the last fifty years.

I did a deep dive into the woes facing American Catholicism.

Some graphs in a 🧵.

graphsaboutreligion.com/p/catholic-mas… The Catholic Church, at the highest level of data, is doing pretty okay given the rise of the nones.

26% of Americans were Catholic in 1972.
25% of Americans were Catholic in 2010.

There has been a noticeable dip in the last 10 years. Down to 21% in 2021. Image
Mar 24, 2023 • 6 tweets • 3 min read
New @RNS - another data entry in the debate over online worship services and the COVID-19 pandemic.

The data comes from Pew and was collected in July of 2020.

There's one staggering stat in here that pastors need to see in the next tweet.

(1/6)

religionnews.com/2023/03/24/cov… I excluded people who said that they didn't attend services before COVID and don't plan to attend after.

That was 43% of the sample.

But, among those who planned to go back after COVID:

39% were not attending AT ALL (either online or in-person) in July of 2020.

(2/6)
Mar 14, 2023 • 6 tweets • 4 min read
I downloaded the data that @JonHaidt uses here to see if religion is moderating the likelihood of reporting mental illness.

A never church attending liberal is nearly 2x as likely to report mental illness compared to a never attending conservative (28% vs 15%). @JonHaidt And here's the religious belonging question.

I made it very simple: do you ID as atheist/agnostic/nothing in particular or with a religious tradition?

Nones are more likely to report mental illness compared to religious folks, regardless of ideology.
Jan 10, 2023 • 5 tweets • 2 min read
New @RNS.

Just how many Catholics actually adhere to the Church's doctrine when it comes to birth control?

Almost none based on the National Survey of Family Growth published @ReligionData.

Short 🧵with the key findings.

religionnews.com/2023/01/10/is-… According to this data - 92% of Catholics have used condoms in their lifetimes. Which is nearly the same as Protestants (~95%).

68% of Catholics have used the pill.

Only 20% of Catholics have practiced the rhythm method, which is permitted by the church.
Sep 14, 2022 • 6 tweets • 3 min read
New podcast episode of @HomebrewedXnty with the incomparable @trippfuller where we go through five graphs I've made over the last few months. And engage in what the kids call "hot takes."

I will thread the five graphs below for reference.

trippfuller.com/2022/09/14/rya… People like to paint people who want to totally ban abortion as from the far, far right of the political spectrum.

Well - they seem downright moderate or even left of center on certain issues.

Jul 7, 2022 • 6 tweets • 3 min read
In May of 2021, Gallup asked ~1000 people if they were pro-choice, pro-life or something else.

They asked the exact same question in May of 2022, after the Dobbs opinion leaked.

The share who said they were pro-choice rose from 49% to 55%. But look at the subgroup shifts

🧵 The share of men identifying as pro-choice rose 3 pts. For women, it jumped nine points (52%->61%).

In terms of age, the share of 18-29 year olds who say they are pro-choice rose FIFTEEEN points in 12 months (56% to 71%). 10 points among those 30 to 49 years old.