New from me @Religion_Public - who are those who were cheering the Dobbs decision last week?
First - it's important to point out that 1/5 Americans want to make abortion illegal in the United States.
But what are their demographics, religion, and ideology?
THREAD (1/5).
First - it's important to point out that 1/5 Americans want to make abortion illegal in the United States.
But what are their demographics, religion, and ideology?
THREAD (1/5).
https://twitter.com/Religion_Public/status/1541406963178807296

I was pretty shocked to learn that the racial composition of those opposed to abortion looks almost exactly like the racial composition of the United States overall.
White folks are not overrepresented in the anti-abortion subset of the population.
White folks are not overrepresented in the anti-abortion subset of the population.

In terms of religion, the gaps aren't as large as many people would assume.
Catholics are 18% of America and 20% of the anti-abortion subset.
Protestants are 12 points different (46% vs. 34%), while the nones are 21% vs 34%. But no other differences to speak of.
Catholics are 18% of America and 20% of the anti-abortion subset.
Protestants are 12 points different (46% vs. 34%), while the nones are 21% vs 34%. But no other differences to speak of.

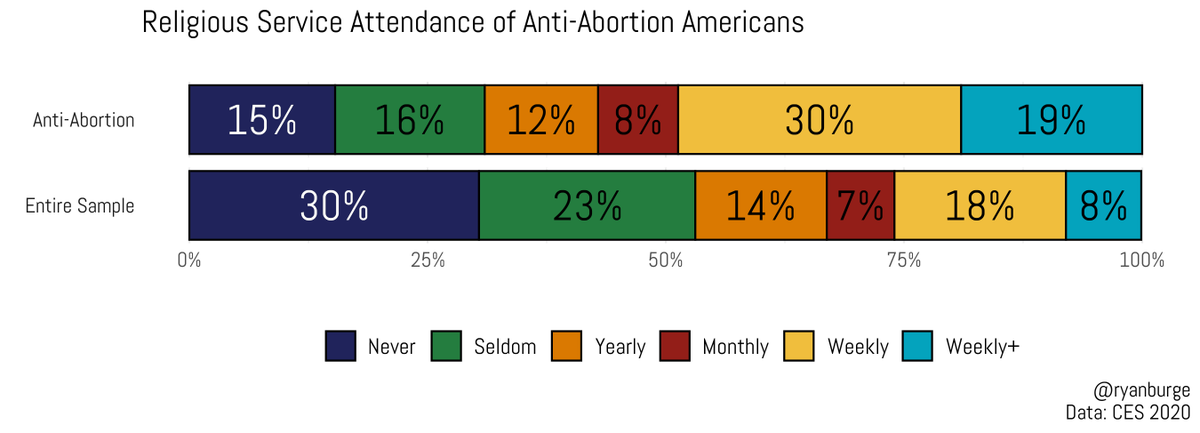
However, when it comes to church attendance that disparity between the two groups grows substantially.
49% of anti-abortion people attend church weekly or more. It's just a quarter of the gen pop.
It's notable that 31% of anti-abortion folks attend less than yearly, tho.
49% of anti-abortion people attend church weekly or more. It's just a quarter of the gen pop.
It's notable that 31% of anti-abortion folks attend less than yearly, tho.
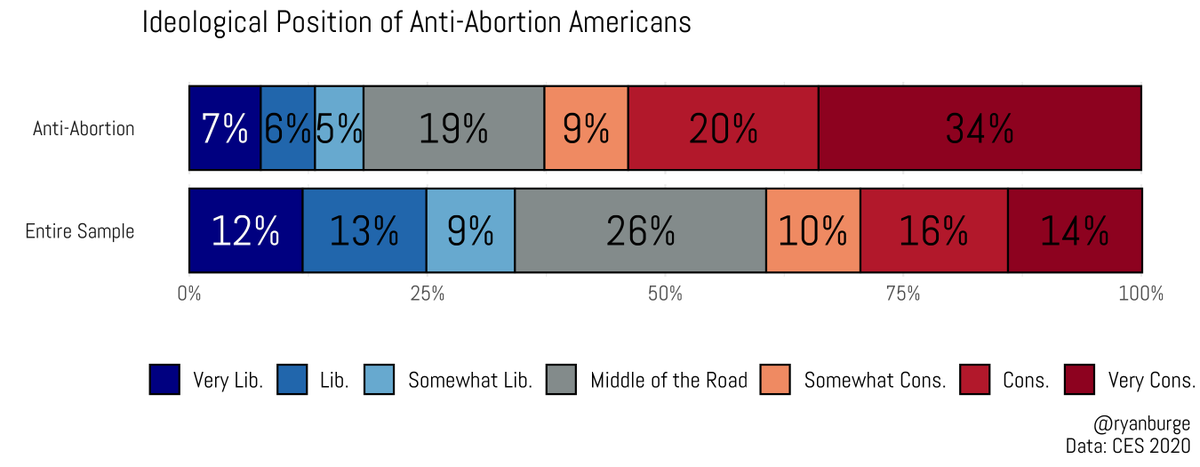
Finally, the political ideology of anti-abortion Americans is obviously more conservative. 63% of them ID as conservative vs. 40% of the gen pop.
However, 18% of anti-abortion people ID as liberal - much higher than I would have guessed.
However, 18% of anti-abortion people ID as liberal - much higher than I would have guessed.
• • •
Missing some Tweet in this thread? You can try to
force a refresh