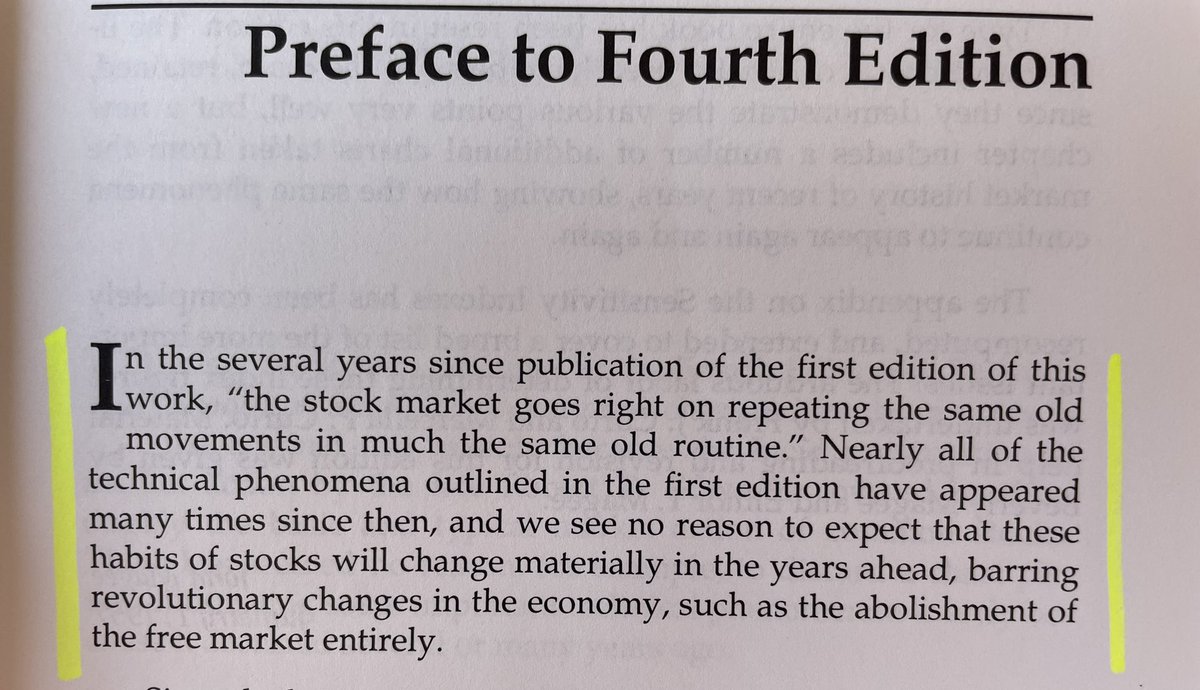
I’m reading through Technical Analysis of Stock Trends (Edwards & Magee) 7th Ed, 1998. The first edition came out in 1948. This thread contains book notes, excerpts, interesting bits.
“The stock market goes right on repeating the same old movements and much the same routine.”
The first edition came out <20 years after the Crash of 1929. Editions after included the prior charts from the boom & bust leading up to & after and are excellent for learning history of crazed euphoria and despair. It does remind me of ‘98-02 in particular. #Study the action.
Dow Theory pervades the book. Knowing & following the Primary Trend is critical. A study of Dow Theory’s 50 yr track record from 1897-1956 turned $100 into 11,237. Obviously compounding matters greatly.
Definition of TA - “the study of the action of the market itself…usually in graphic form.” I consider tabulation of market data to also fall under that criteria. Price is the truth to know & study when it come to markets.
“Only price pays” (@alphatrends)
p. 6 (Edward & Magee)
“There is nothing wrong with charts - the trouble is with the chartists.”
On divergences…
There are so many charts with pattern examples throughout. But note that these are all OHLC sticks. Candlestick charting was basically unknown to the western world until Steve Nison wrote Japanese Candlestick Charting Techniques in 1991.
The chapter on “Futures/Derivatives Charts” includes many indicators, uses of MAs, oscillators that we now routinely apply across all assets. They have their place if used correctly.
From the Midword…”The problem …is not so much a matter of systems as it is a matter of philosophy.”
The Tactical Problem
Need to shape the battlefield tactics to decisively win.
Be thankful we have computers and don’t have to plan our day around when we get the newspaper, how our lighting is, what size the desk is, what kind of graph paper we use, or if our dozen pencils are sharp enough.
How sensitive are your holdings? Do they have room to run?
It was only since 1975 that competitive commissions have existed. Prior to that, a round trip of $1,000 worth of stock would cost 4.4%. Be thankful for competition. It forces everyone to be better.
Have a system and stick to it. It will save you from ruin…capital and mental.
Peace of mind comes from preserving capital. (p. 562)
• • •
Missing some Tweet in this thread? You can try to
force a refresh
And obviously I forgot what year it is...this occurrence today would be the first sequence of the events in nearly *two* years (March 9, 2021 was the last)
Rare breadth thrust on $SPX: Only 6 prior times (since 1985) when...
Fewer than 10% of $SPX stocks were under their 50-MA, then jumped to 90% above within 2 months
Avg returns of 23% a year later, but the very low interim drawdowns of -2.8% are the thing to see. 👇 1/3 $SPY
Items of note: 1) Not a statistically significant sample size, but all were higher after 3 months 2) R:R out a year is 8.2x 3) The low after 4/29/09 was Day 1 4) The low after 5/26/20 was Day 12 (not a typo)
See event specifics in table I ran via @MarketCharts below. 2/3
Some will surely say "yeah but we've never had a situation like this, with inflation, the Fed" etc. Every one of these prior events came from times when "We've never had..." GET OVER IT, and learn from similar events of awful sentiment turning into breadth thrust.
3/3
#Capitulation is not well understood. It means massive selling, where the bulk of likely sellers give up, en masse.
It does not usually mean "the bottom".
It does not require a $VIX jump or spiking put/call ratio.
Mid-June has many examples. Here are some...
(Thread 👇)
Capitulation example #1:
Spike in 52-wk lows
$SPX new lows hit 42% on June 16, closed at 39%. Only 16 lower readings since 1985.
Capitulation example #2:
Massive $NYA NYSE Composite down volume
98.5% June 13
96.3% June 16
It's unfortunate how many on Twitter (even from notable names) only use Advance/Decline metrics as the only measure of breadth. Don't be so short-sighted that you miss opportunities. Study, learn, and apply for yourself. There are so many other breadth measures... $SPX $SPY 1/
Very strong breadth when considering that the % of $SPX stocks above their 10-day moving average just went from below 10% to 90% in less than 10 days. 2/ marketcharts.com/page/e5d862dd
Strong move in % of $SPX stocks advancing, from below 10% to 90% in a short period of time. 3/ marketcharts.com/page/5555e817