Jonathan Harrier, CMT Profile picture
I post charts, backtests, trade strategies, and journal thoughts on abnormal market events. Nothing is advice, just information.
RICH Man Profile picture 1 subscribed
Feb 28, 2023 β€’ 4 tweets β€’ 2 min read
Today:
1) $VIX crossed below its 50-ma but is still > 20
2) $VIX 50-ma is < 200-ma
3) $SPX is > 200-ma

First time in a year.

$SPX 3 months later, past 20 years (N=16)
100% were higher
+8.1% avg gain
-1.9% avg drawdown
+9.6% avg max gain over the 3 months

Event details πŸ‘‡ 
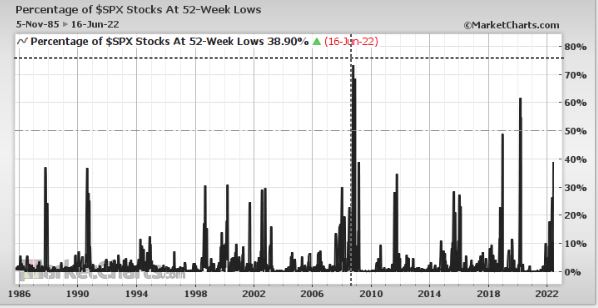
Full study details can be seen via the backtest I ran using @MarketCharts
marketcharts.com/page/57f01dc4
Aug 14, 2022 β€’ 4 tweets β€’ 2 min read
Rare breadth thrust on $SPX: Only 6 prior times (since 1985) when...

Fewer than 10% of $SPX stocks were under their 50-MA, then jumped to 90% above within 2 months

Avg returns of 23% a year later, but the very low interim drawdowns of -2.8% are the thing to see. πŸ‘‡
1/3
$SPY Items of note:
1) Not a statistically significant sample size, but all were higher after 3 months
2) R:R out a year is 8.2x
3) The low after 4/29/09 was Day 1
4) The low after 5/26/20 was Day 12 (not a typo)
See event specifics in table I ran via @MarketCharts below.
2/3
Jul 23, 2022 β€’ 9 tweets β€’ 3 min read
#Capitulation is not well understood. It means massive selling, where the bulk of likely sellers give up, en masse.
It does not usually mean "the bottom".
It does not require a $VIX jump or spiking put/call ratio.
Mid-June has many examples. Here are some...
(Thread πŸ‘‡) Capitulation example #1:
Spike in 52-wk lows
$SPX new lows hit 42% on June 16, closed at 39%. Only 16 lower readings since 1985.
Jul 1, 2022 β€’ 17 tweets β€’ 5 min read
I’m reading through Technical Analysis of Stock Trends (Edwards & Magee) 7th Ed, 1998. The first edition came out in 1948. This thread contains book notes, excerpts, interesting bits. β€œThe stock market goes right on repeating the same old movements and much the same routine.” Image
Dec 11, 2021 β€’ 16 tweets β€’ 6 min read
It's unfortunate how many on Twitter (even from notable names) only use Advance/Decline metrics as the only measure of breadth. Don't be so short-sighted that you miss opportunities. Study, learn, and apply for yourself. There are so many other breadth measures... $SPX $SPY 1/ Very strong breadth when considering that the % of $SPX stocks above their 10-day moving average just went from below 10% to 90% in less than 10 days. 2/ marketcharts.com/page/e5d862dd