
How to Spot New Leaders in BEAR Market
A Short Thread🧵
If you want a Youtube Video drop a " YES"
A Short Thread🧵
If you want a Youtube Video drop a " YES"
Inspiration and credits: Mark Minervini sir
Youtube Link :
1/n
Youtube Link :
1/n
What to Look for ?
2/n
2/n


Screener for stocks that are within 25% of their Highs
The screener filters out Stocks that have
1. Relative Strength Positive
2. Above 50 dema on
3. Above 30 wema ( in Stage 2)
4. Volume greater than 50k
5. Above 20 rs
chartink.com/screener/stock…
3/n
The screener filters out Stocks that have
1. Relative Strength Positive
2. Above 50 dema on
3. Above 30 wema ( in Stage 2)
4. Volume greater than 50k
5. Above 20 rs
chartink.com/screener/stock…
3/n

Example of Stocks that have Corrected less than 25% in this Bear Market
Always Look for Stocks that in longer term uptrend and still near 52 week high .
These Stocks tend to outperform when market recovers
Stock vs Nifty50
#Bls #MFL #Timken
4/n
Always Look for Stocks that in longer term uptrend and still near 52 week high .
These Stocks tend to outperform when market recovers
Stock vs Nifty50
#Bls #MFL #Timken
4/n


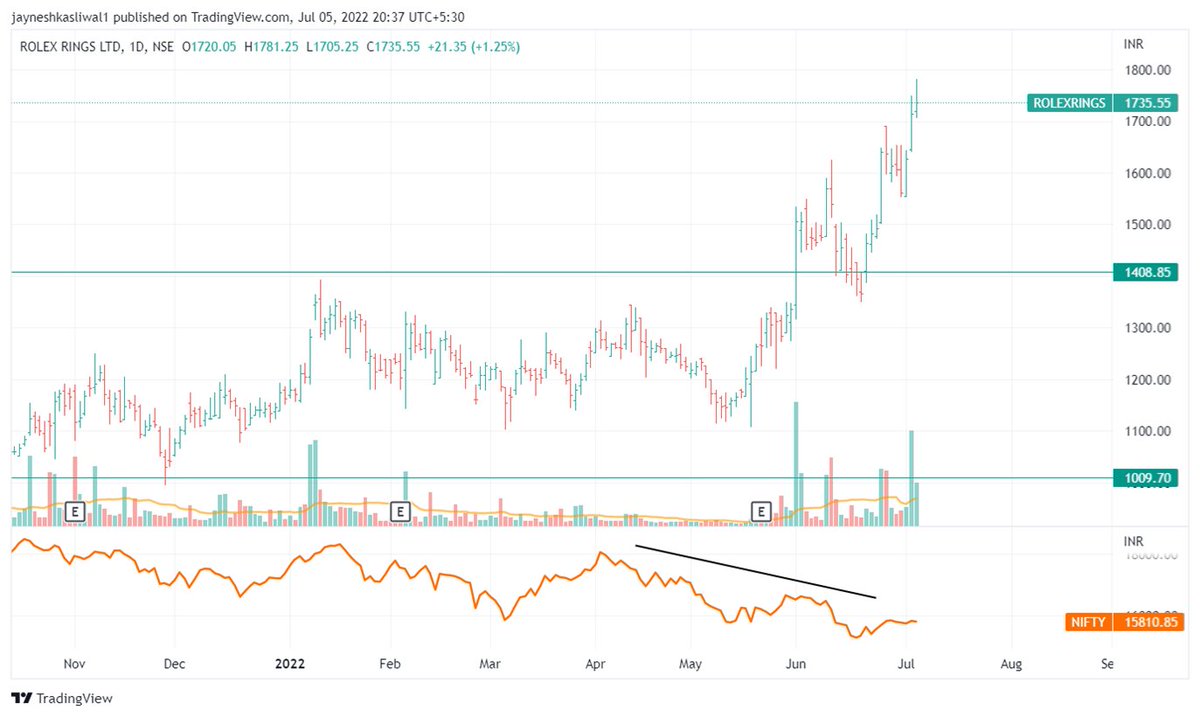
Ipo base stocks
#Tarsons gave a cheat entry within its ipo base . Stock is up more than 20% in few days
#Rolexrings : Stock had broken out of its ipo base and gave a decent rally as markets recovered
5/n
#Tarsons gave a cheat entry within its ipo base . Stock is up more than 20% in few days
#Rolexrings : Stock had broken out of its ipo base and gave a decent rally as markets recovered
5/n

#Homefirst: Stock hasnt broken out but has good Volatility contration and near the retest of old breakout
#Metrobrands consolidating from past 6 months
breakout can give good Rally
#Kpigreen
6/n
#Metrobrands consolidating from past 6 months
breakout can give good Rally
#Kpigreen
6/n


What we want to see :
Signs of Accumulation
Followthrough in breakout
Good market Breadth
7/n
Signs of Accumulation
Followthrough in breakout
Good market Breadth
7/n

Look for Stocks that are breaking out when market is correcting
8/n
8/n


Characteristics of a leader:
AMAZON in 2002 vs AMAZON in 2022
9/n
AMAZON in 2002 vs AMAZON in 2022
9/n


THINK DIFFERENT !
1. look at the old leaders the old leaders are not most likely going to lead in the new cycle it's very difficult to do
2. they're not going to go out of business see a stock doesn't have to go out of business to make you go out of business
10/n
1. look at the old leaders the old leaders are not most likely going to lead in the new cycle it's very difficult to do
2. they're not going to go out of business see a stock doesn't have to go out of business to make you go out of business
10/n
Some went down and moved sideways and some of them didn't come back to break even for 20 years
Guess Which Indian Stock ? vs $MFST
11/n
Guess Which Indian Stock ? vs $MFST
11/n


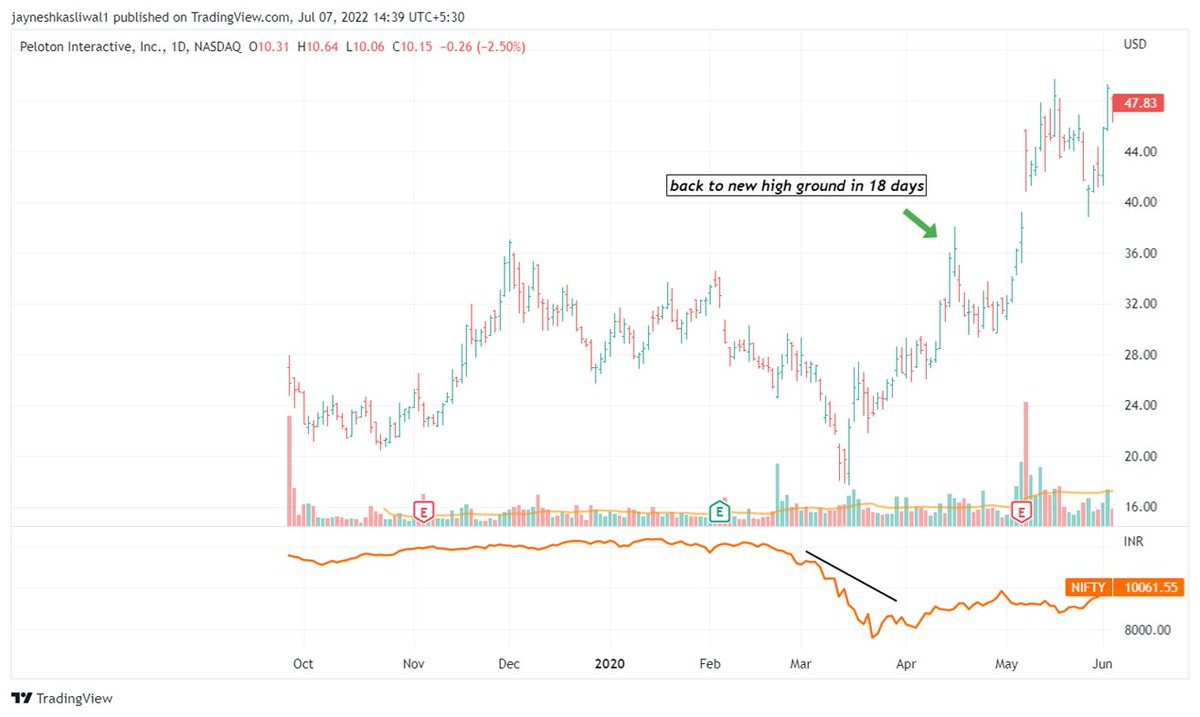
Fast rebound Stocks
1. stock come ripping back off the lows and this is where you should be looking to buy
2. These stocks move 20-50% in Small duration during small market recovery from the lows and reach their highs
12/n
1. stock come ripping back off the lows and this is where you should be looking to buy
2. These stocks move 20-50% in Small duration during small market recovery from the lows and reach their highs
12/n

MentorShip Program:
SWING TRADING MENTORSHIP GROUP!
✅Mentorship starting on 9th July on weekends only with recording
LINK FOR ENQUIRY:
wa.link/si4jn4
Payment Link :tagmango.app/4efa5b90c1
13/n
SWING TRADING MENTORSHIP GROUP!
✅Mentorship starting on 9th July on weekends only with recording
LINK FOR ENQUIRY:
wa.link/si4jn4
Payment Link :tagmango.app/4efa5b90c1
13/n

There are 100s of stocks in screener
To filter more use this criteria
Eps Growth Qtr on Qtr
Eps Growth Yr on Yr
Fiis Increasing Stake
Roe and Roce >15
Use combination of the above criteria
To filter more use this criteria
Eps Growth Qtr on Qtr
Eps Growth Yr on Yr
Fiis Increasing Stake
Roe and Roce >15
Use combination of the above criteria
• • •
Missing some Tweet in this thread? You can try to
force a refresh


