Something magic happened in July 2020.
Since then, you can predict the future. With 95% accuracy.
It's worked perfectly for over 2 years.
The 1% who know have made billions betting on it.
But nobody else is paying attention.
Here's how you can use this too 👇
Since then, you can predict the future. With 95% accuracy.
It's worked perfectly for over 2 years.
The 1% who know have made billions betting on it.
But nobody else is paying attention.
Here's how you can use this too 👇
You've heard of the #Fed's Balance Sheet, the #FedFundsRate, and how they've been the central driver of markets for decades.
But the truth is, the size of the Fed's balance sheet doesn't matter.
And the FFR matters even less.
Don't believe me?
But the truth is, the size of the Fed's balance sheet doesn't matter.
And the FFR matters even less.
Don't believe me?
The Fed's Bal Sheet size and FFR used to matter. A lot.
They *were* the central driver of markets for a long time.
But the world changed in 2020.
The system was rebuilt. And the rules were completely rewritten.
They *were* the central driver of markets for a long time.
But the world changed in 2020.
The system was rebuilt. And the rules were completely rewritten.
You see, in mid-2020, the Fed threw a party.
The most grande fiesta of all time.
It printed around 4.5 trillion dollars. An unprecedented, world-shattering golden shower of money.
And it roughly doubled the size of its balance sheet.
But you're probably already aware of this
The most grande fiesta of all time.
It printed around 4.5 trillion dollars. An unprecedented, world-shattering golden shower of money.
And it roughly doubled the size of its balance sheet.
But you're probably already aware of this

What's different this time around is what happened with that money.
Not to be one-upped, the US Treasury set down its margarita and beer-bonged a fifth of financial tequila to the face.
Provisioning itself with 1.8 trillion dollars — 4.5x what it had ever done before:
Not to be one-upped, the US Treasury set down its margarita and beer-bonged a fifth of financial tequila to the face.
Provisioning itself with 1.8 trillion dollars — 4.5x what it had ever done before:

As it deployed that 1.8 trilly, something remarkable happened.
The firehose of money coming out of the Treasury was so big it became sole driver of markets.
Liquidity took over as the only thing that mattered.
$SPX snapped into near perfect inverse correlation w/ TGA balance:
The firehose of money coming out of the Treasury was so big it became sole driver of markets.
Liquidity took over as the only thing that mattered.
$SPX snapped into near perfect inverse correlation w/ TGA balance:

Eventually, things got out of hand.
The flood of liquidity drove the cost of living for Americans 33% higher in under 2 years 🤮
It was a runaway shitshow with no sign of slowing down.
The flood of liquidity drove the cost of living for Americans 33% higher in under 2 years 🤮
It was a runaway shitshow with no sign of slowing down.

This was bad.
The Fed & Treasury knew they needed to call the cops on their own party.
But they wanted to do it mostly in secret.
So they kept us focused on the old metrics (FFR and size of the Fed's balance sheet). And began executing an ingenious plan in the background...
The Fed & Treasury knew they needed to call the cops on their own party.
But they wanted to do it mostly in secret.
So they kept us focused on the old metrics (FFR and size of the Fed's balance sheet). And began executing an ingenious plan in the background...
1) Treasury issued fewer short-dated T-Bills. This created a shortage in low-duration paper that financial institutions need to be able to provide liquidity to the economy.
2) Simultaneously, Fed raised award rate on Reverse Repo (the next best low-duration-risk alternative)...
2) Simultaneously, Fed raised award rate on Reverse Repo (the next best low-duration-risk alternative)...

The result?
Over $2 trillion of liquidity got sucked into Reverse Repo and became unavailable to circulate in the economy.
Six times more than had ever been done before.
Over $2 trillion of liquidity got sucked into Reverse Repo and became unavailable to circulate in the economy.
Six times more than had ever been done before.

So what does this all mean and why does it matter?
And how does it help you predict the future?
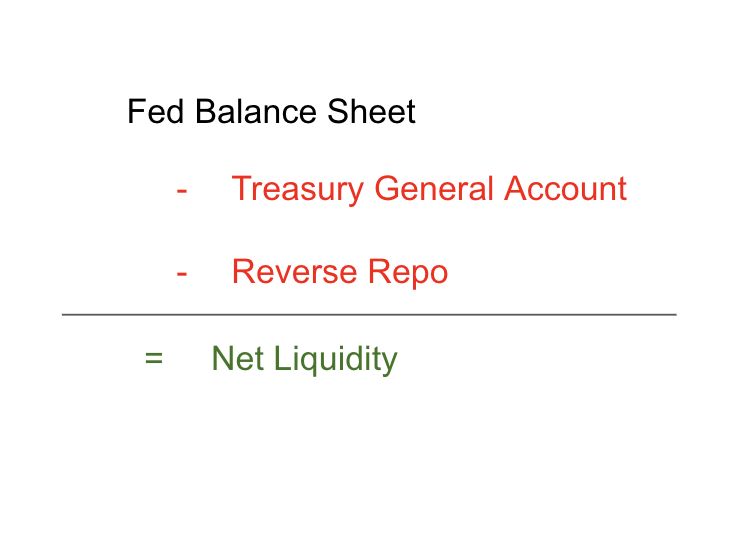
It all comes down to something called 💦 Net Liquidity.
And how does it help you predict the future?
It all comes down to something called 💦 Net Liquidity.
Net Liquidity is the amount of $ actually available to circulate in the economy.
It's calculated as:
⬆️ Size of the Fed's Balance Sheet
⬇️ Minus how much of that has been sucked out into the Treasury
⬇️ Minus how much has been sucked out into Reverse Repo
It's calculated as:
⬆️ Size of the Fed's Balance Sheet
⬇️ Minus how much of that has been sucked out into the Treasury
⬇️ Minus how much has been sucked out into Reverse Repo
In past cycles, size of Fed's balance sheet changed a lot, while TGA and RRP changed relatively little.
So size of balance sheet roughly equated Net Liquidity.
TGA and RRP didn't matter. They were rounding errors by comparison.
So size of balance sheet roughly equated Net Liquidity.
TGA and RRP didn't matter. They were rounding errors by comparison.
But starting in 2020, relative changes in TGA and RRP have been THREE TIMES LARGER than the change in size of the Fed's balance sheet.
As result, changes in TGA and RRP have taken over as the primary drivers Net Liquidity.
This is new, and changes the game significantly.
As result, changes in TGA and RRP have taken over as the primary drivers Net Liquidity.
This is new, and changes the game significantly.


Again - the size of the Fed's balance sheet doesn't matter.
What matters is the portion of it that's available to circulate in the economy (Net Liquidity).
And ever since 2020, the Treasury and Reverse Repo have become what controls that. Not the size of Fed's balance sheet.
What matters is the portion of it that's available to circulate in the economy (Net Liquidity).
And ever since 2020, the Treasury and Reverse Repo have become what controls that. Not the size of Fed's balance sheet.
So, now that you understand Net Liquidity, let's take a look at how it correlates to asset prices looking back over the past 2 years.
The next chart plots 🟢 Net Liquidity vs. 🔵 S&P 500 offset backwards by 2 wks:
The next chart plots 🟢 Net Liquidity vs. 🔵 S&P 500 offset backwards by 2 wks:
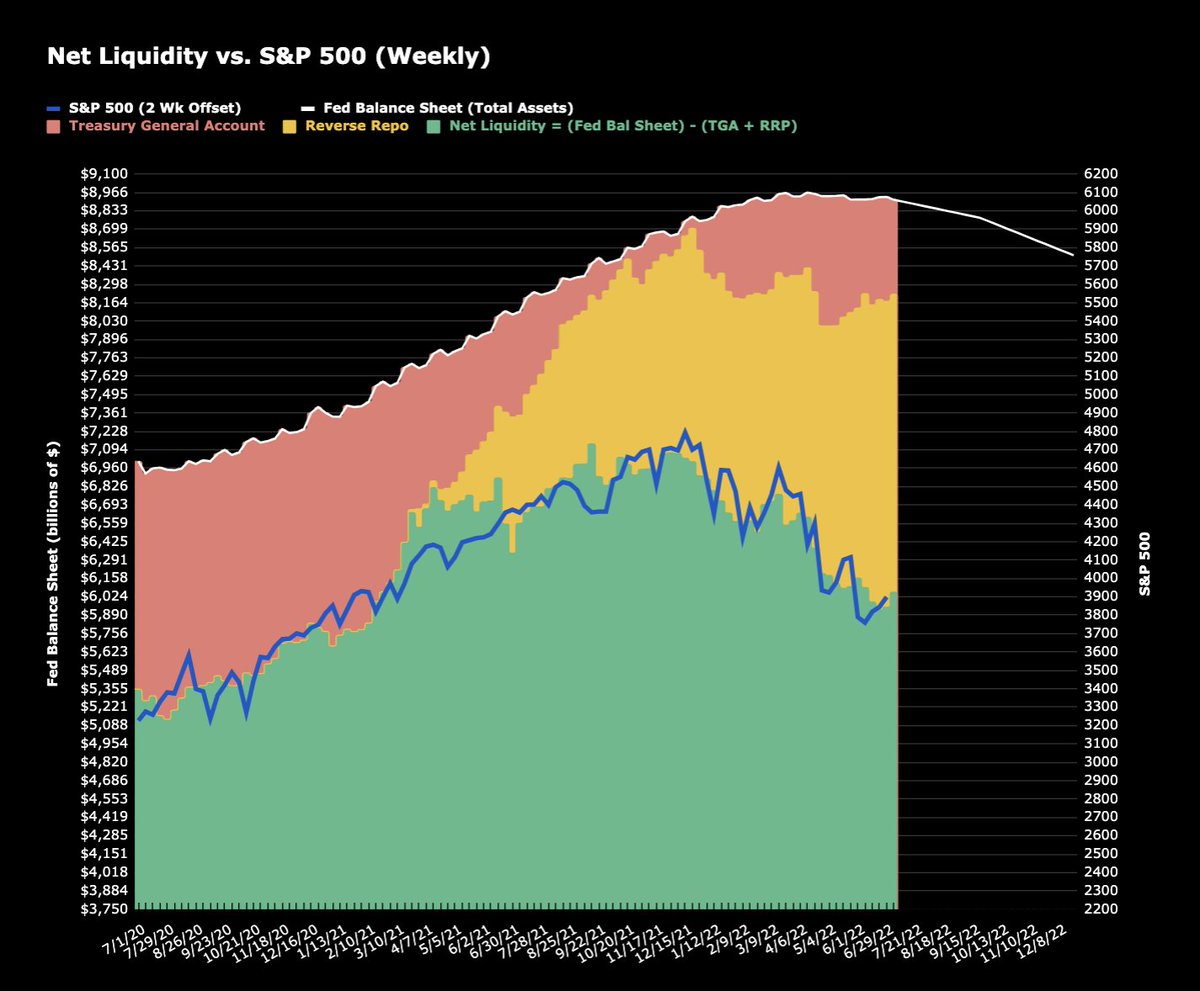
As you can see, there's an extremely tight correlation. R=0.95
Basically, when there's a change in Liquidity, it takes 2 wks to propagate out into the economy & impact asset prices.
And that change in Liquidity predicts next 2 wk's change in asset prices with 95% correlation.
Basically, when there's a change in Liquidity, it takes 2 wks to propagate out into the economy & impact asset prices.
And that change in Liquidity predicts next 2 wk's change in asset prices with 95% correlation.
So, if all you do is watch how Net Liquidity changes this week, you can predict where S&P is likely to go over the next 2 wks.
With 95% accuracy. 🤯
Here's the data sources needed to track this yourself:
With 95% accuracy. 🤯
Here's the data sources needed to track this yourself:
2) Treasury General Account: fsapps.fiscal.treasury.gov/dts/issues/202…
Updated daily at 4pm Eastern
Updated daily at 4pm Eastern
• • •
Missing some Tweet in this thread? You can try to
force a refresh