
Bootstrapped SaaS co to $15mm ARR. Helped take another from 0 to NASDAQ IPO
 If you’re an American who spends most of your money traveling abroad, then yes, it feels amazing when the dollar is strong
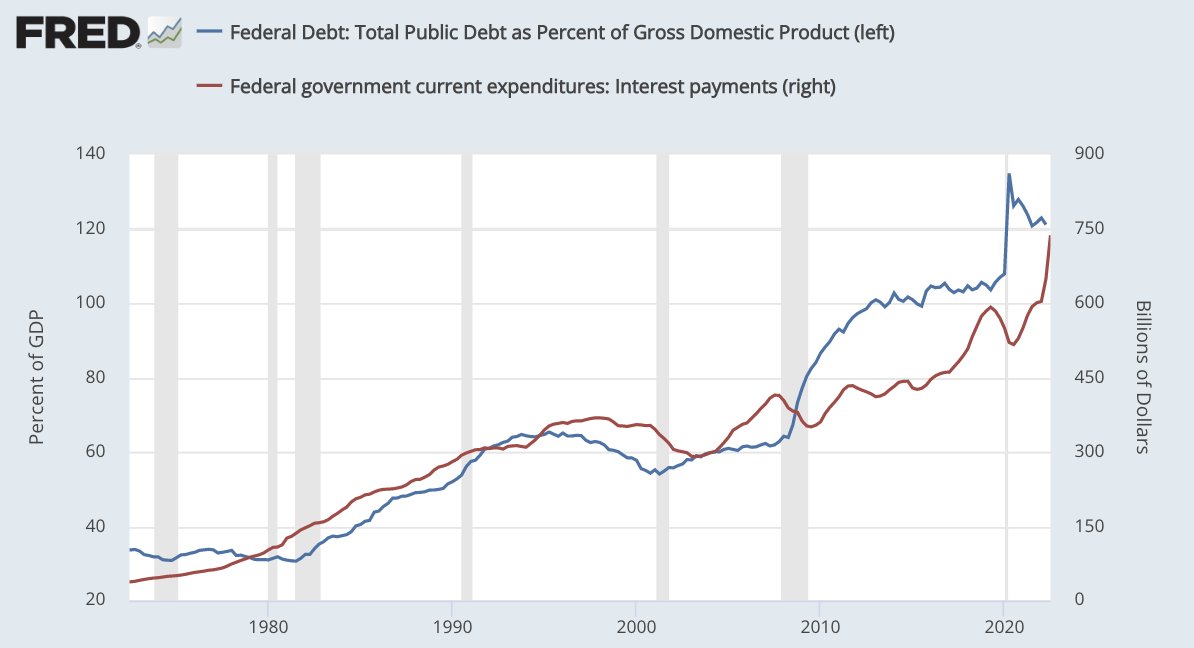
 Coming out of WW2, the US federal debt hit a whopping 120% of GDP
 If rates stay at 5.5%
 Watch RRP closely over the coming days. If RRP continues drawing down aggressively (esp by more than what's required to fill the TGA) it may indicate the time has finally come for that sidelined $2T to re-enter the game
 Based on most recent TBAC recommendations:
 There’s $2tn of excess liquidity still trapped in RRP
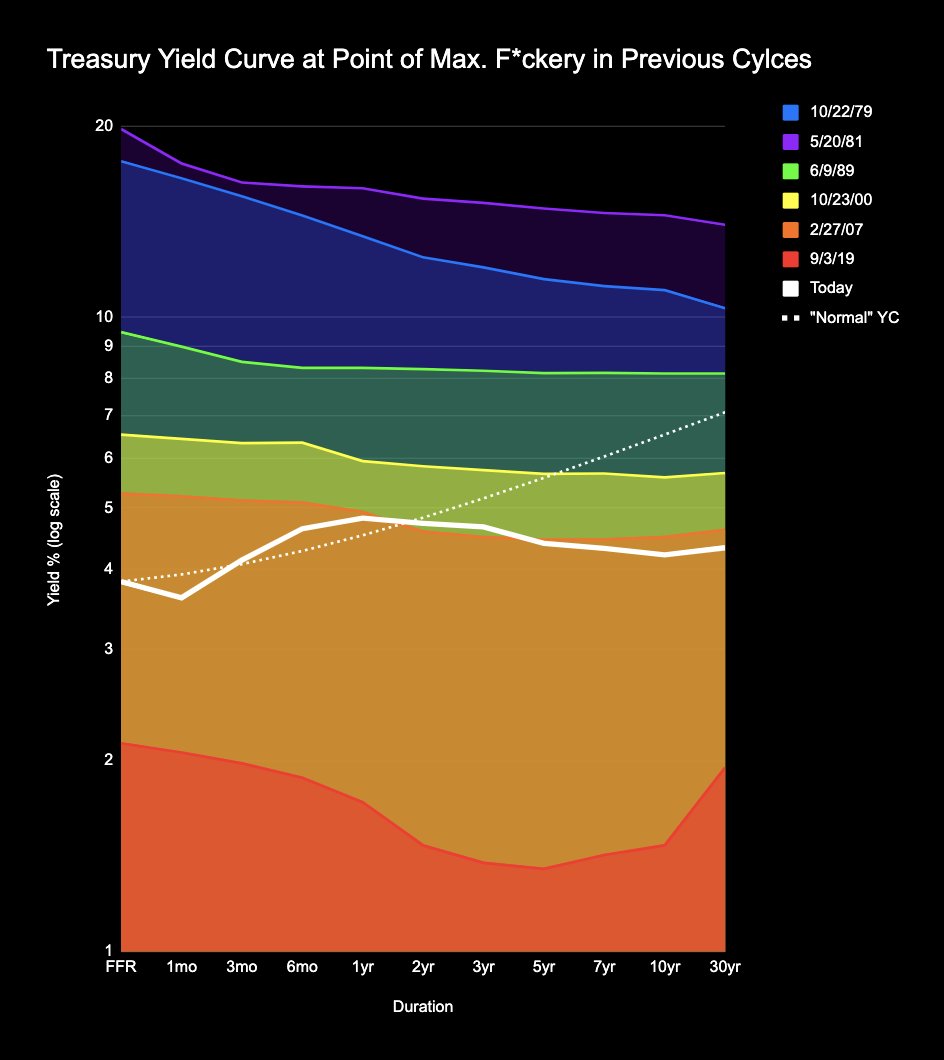
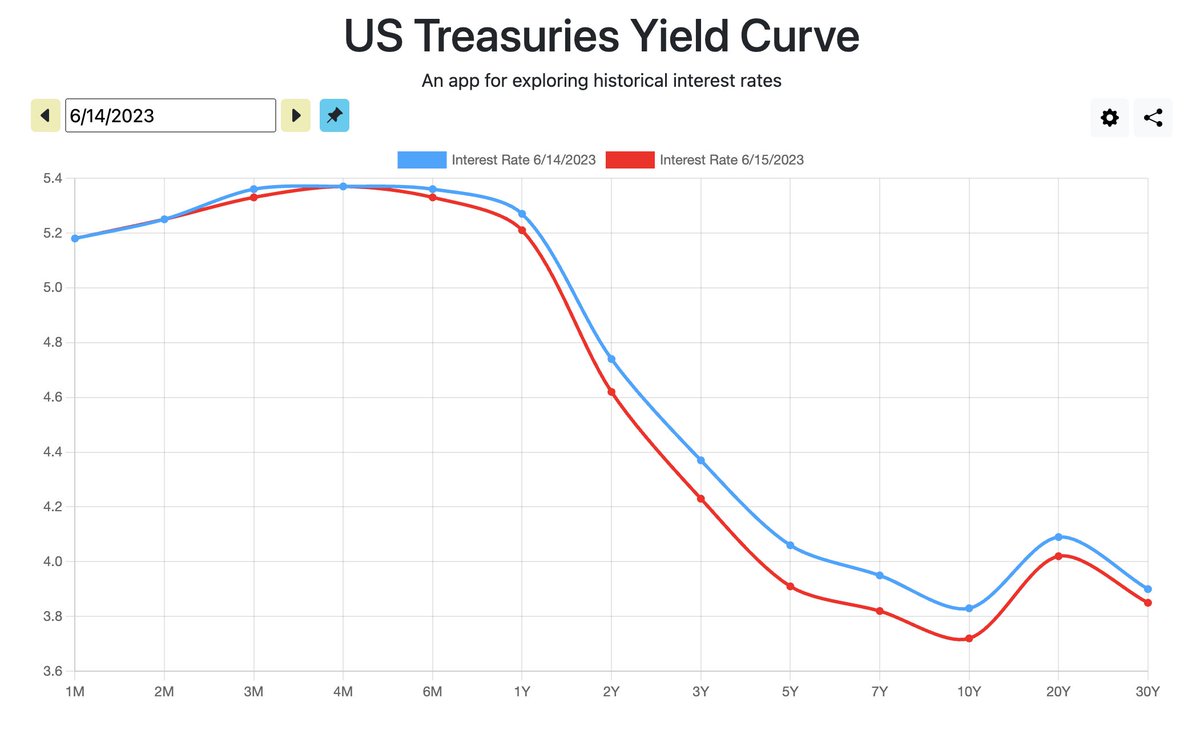
 You'll hear a lot of talk about the 2y/10y and 3m/10yr both being *technically* inverted right now


 What a f*cked yield curve looks like:


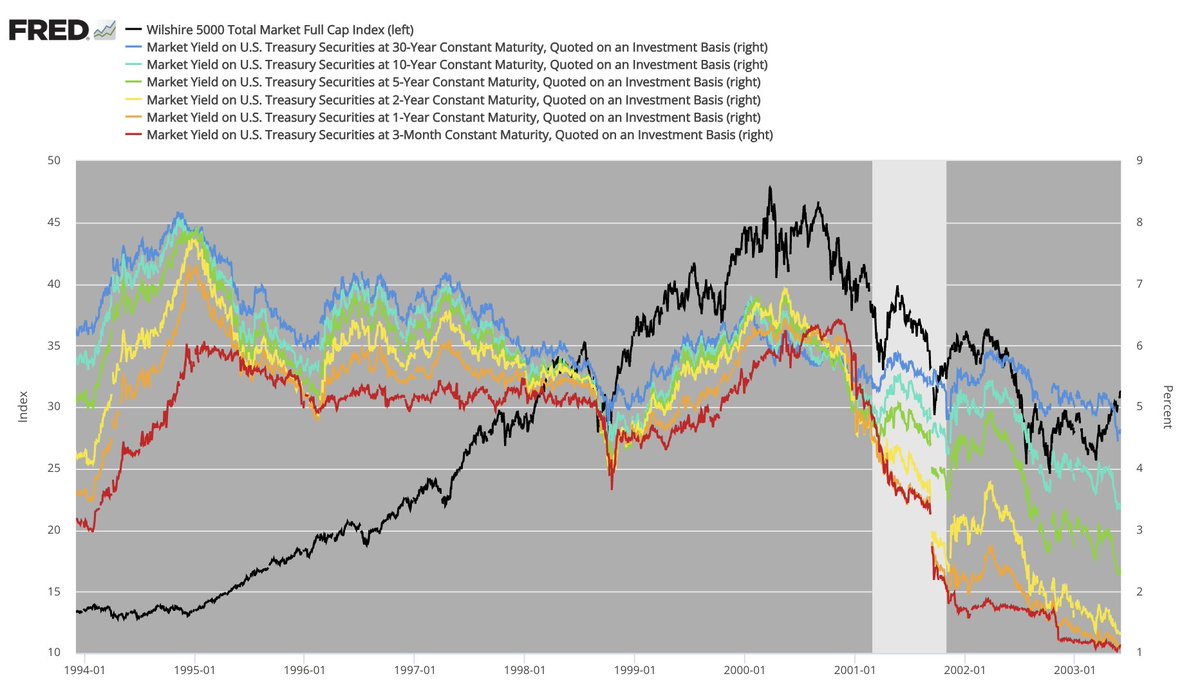
 Zoomed in to highlight past few recessions:


 If you're not familiar with Net Liquidity 💦, and $SPX's remarkable correlation to it, take a moment to read this thread:

 No obvious moves here, but if $SPX drifts above ~4050 (>200pts above fair value), I will likely put on an unlevered short via $SH to hold through EOY or retest of June lows, whichever comes sooner
 Looking ahead, one major potential downside catalyst to be aware of: