Chris Perruna Profile picture
Jul 16 4 tweets 2 min read
Passive vs Active Investing

People always forget about costs, taxes and inflation when looking at real returns over time, they chop into returns in a big way, especially when compounding the end result.

4.8% annually vs 2.0% annually, over 30 years is a HUGE difference.

#Thorp
Chart from A Man for All Markets by Thorp.

Another one:
A very simple example:

$10,000 into each scenario with zero contributions over 30 years nets:

$65,230 (passive, 4.8%)

vs

$22,080 (active, 2.0%)

Passive beats active by ~3x, when compounded over 30 years with lower fees, taxes and inflation.
Short term taxes really eat away profits, in a major way, over time.

Chart: A Man for All Markets

• • •

Missing some Tweet in this thread? You can try to force a refresh
 

Keep Current with Chris Perruna

Chris Perruna Profile picture

Stay in touch and get notified when new unrolls are available from this author!

Read all threads

This Thread may be Removed Anytime!

PDF

Twitter may remove this content at anytime! Save it as PDF for later use!

Try unrolling a thread yourself!

how to unroll video
  1. Follow @ThreadReaderApp to mention us!

  2. From a Twitter thread mention us with a keyword "unroll"
@threadreaderapp unroll

Practice here first or read more on our help page!

More from @cperruna

Jun 7
Michael Burry, of 'The Big Short' fame, compared the slowing housing market to 2008 saying it's like 'watching a plane crash'

👀🤷‍♂️ Image
Mortgage demand falls to the lowest level in 22 years

Applications for a mortgage are 21% lower than the same week one year ago.

cnbc.com/2022/06/08/mor…
This thread is worth a read...

Legitimate signs or just a brief cooling off period...?

Cooling in 2022 is nothing like 2005-2008. Far different reasons today vs then.

Read 4 tweets
May 7
🧵A comparison of drops for the % of stocks below their own 200d ma on the Nasdaq.

- 2001-02: long duration
- 2008: long duration
- 2018 & 2020: quick v-shaped
- 2022: long duration

Below 15% is the accumulate zone but ONLY when stage 1 & 2 bases are forming!

$COMPQ
2/ July 7th:

"Divergences on the charts:

The index is going up but the # of stocks above these averages is not.

Watch breadth."

3/ July 7th:

"$COMPQ making new highs while the # of stocks making new highs decreases. Divergence.

"The averages are merely the backdrop of the game; the real contests are waged over stocks themselves" - Mamis"

Read 10 tweets
Apr 3
🧵March 2022 Portfolio Update:
*through April 3rd

Past Month Performance:
Crypto: +11.9%
IRA Acct: +3.70%
Growth Acct: +1.45%

YTD:
Crypto Act: -3.6%
IRA Act: -9.29% | Fully invested
Growth Act: -11.23% | 80.5% cash

$SPX -4.62%
$COMPQ -8.84%
$ARKK -28.6%
2/ Growth Account Holdings

-11.23% YTD
+1.45% past month
Cash: 80.5%

$PLTR 3.9%
$SQ 3.8%
$COIN 2.6%
$TDOC 2.1%
$SHOP 2.0%
$MQ 2.0%
$ROKU 1.8%
$RBLX 1.3%
3/ IRA Holdings

-9.29% YTD
+3.70% past month
Cash: 0%, fully invested

$AAPL
$AMZN
$COST
$CVS
$DIS
$FB
$GOOGL
$HD
$JNJ
$JPM
$MSFT
$NFLX
$PG
$SBUX
$T
$TDOC
$TGT
$V
$VZ
$WMT

Looking to replace $T
Read 4 tweets
Mar 30
🧵Bear Flag Pattern

Stocks can often gain 100%+ on the move, quickly.

But notice the longer term trend & 200d ma.

Can these 12 beaten down stocks recover the 200d?
If so, how long will it take?

$ARKK is the group example

All 12 are still -35% to -65% below the 200d ma
2/ $PTON
3/ $FSLY
Read 15 tweets
Mar 27
🧵Is a Perfect Storm brewing for a global famine?

"We believe we are at the onset of a global famine of historic proportions."

The populations most at risk... are half a world away & we worry that that number is uncomfortably high.

Must read @DoombergT

doomberg.substack.com/p/farmers-on-t…
2/ Fertilizer prices at record highs!

Key sources of nitrogen, potassium, and phosphorous – important inputs into soil fertility, crop yield, and plant maintenance – have all gone vertical.

Via: @DoombergT
3/ Ammonia is derived directly from natural gas, and the price of natural gas outside of the US has gone vertical.

Glyphosate is effectively little more than an elegantly modified fertilizer, containing both phosphorous and nitrogen.

Via: @DoombergT
Read 8 tweets
Mar 22
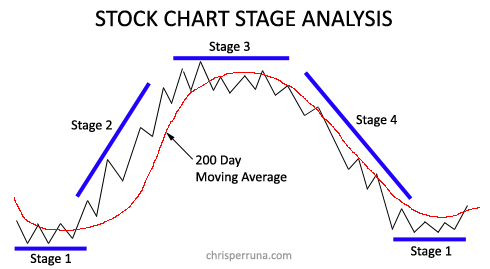
🧵Stock Chart Stage Analysis

5 examples of stocks that just went through stages 2, 3 and 4 (all currently in stage 4).

Ideal Buy: In Stage 2 (above 200d)
Ideal Sell: In Stage 4 (below 200d)

$TDOC
$PTON
$ZM
$RDFN
$ROKU
2/ $TDOC - currently in stage 4, well below the 200d ma.
3/ $PTON - currently in stage 4, well below the 200d ma.
Read 6 tweets

Did Thread Reader help you today?

Support us! We are indie developers!


This site is made by just two indie developers on a laptop doing marketing, support and development! Read more about the story.

Become a Premium Member ($3/month or $30/year) and get exclusive features!

Become Premium

Don't want to be a Premium member but still want to support us?

Make a small donation by buying us coffee ($5) or help with server cost ($10)

Donate via Paypal

Or Donate anonymously using crypto!

Ethereum

0xfe58350B80634f60Fa6Dc149a72b4DFbc17D341E copy

Bitcoin

3ATGMxNzCUFzxpMCHL5sWSt4DVtS8UqXpi copy

Thank you for your support!

Follow Us on Twitter!

:(