Chris Perruna Profile picture
Owner's Rep, investor & weather enthusiast. Husband, dad, dogs & sports. My only account has a blue checkmark. Beware of impersonators. No investment advice!
Alex Muzychenka Profile picture wz Profile picture نايف 42 Profile picture Floxed Profile picture StockEducator.Pro Profile picture 27 subscribed
Jan 4 10 tweets 3 min read
🧵PayPal $PYPL $58.64

Will it go higher in 2024?
-80% off highs
+67% from IPO in 2015
+740% at peak in 2021

Thread showing the 10-year history of:
- Price
- Revenue
- Net Income
- EPS
- Cash
- Free Cash Flow
- Long Term Debt
- Return on Equity
- Profit Margin
- EBIT Image 2/ $PYPL revenue Image
Sep 24, 2023 11 tweets 4 min read
🧵10 Stocks with Strong Fundamentals

These 10 stocks all have positive:
- Net Income
- EBIT
- EPS
- Free Cash Flow
- ROE

Listed from highest EPS to Lowest

$SMCI
$NOW
$ANET
$ON
$ELF
$ALGM
$ARRY
$DLO
$TTD
$ADYEY

But let’s take a look at the technicals - some analysis in thread: Image $SMCI - $235.75

The stock is pulling back the past seven weeks, now below the 10wk/50d but still above the 40k/200d.

A base at or near the 200d ma would be appealing for a possible add. Image
Jun 5, 2023 13 tweets 4 min read
🧵When to Sell

A breakdown of the slides:

- Stage Analysis
- Market Breadth
- Market Cycle
- Fundamentals

Video (CP starts at 1 hour and 34 minute mark): youtube.com/live/RAO9qls_Z…

Via @TraderLion_ & @RichardMoglen Image
Feb 12, 2023 7 tweets 2 min read
🧵 Stock Screens that I use Weekly

1. Quality Stocks that are trading within 15% of 52-week Highs

2. Quality Stocks making New 52-week Highs

3. Institutional Sponsorship Increasing

4. Quality Stocks with a new IPO’s within the past two Years 1. Quality Stocks that are trading within 15% of 52-week Highs
Jan 22, 2023 4 tweets 1 min read
America's young have an epidemic, not a pandemic.
Jan 13, 2023 4 tweets 1 min read
1/ Why did I buy Today?

I initiated a starter position in two stocks for a few reasons:

- They have been acting well, while watching
- Breadth has improved, NH-NL & % above 200d
- Handful of stocks basing stage 1
- Inflation coming down, CPI
- To test the market with real money 2/ I know full well that we could have another leg down in the market so I have minimal dollars at work to test it. Nasdaq is still under the 200d.

I also know that markets look ahead & some signs are strengthening.

This GAME is about making money, not being right or wrong.
Jan 7, 2023 4 tweets 2 min read
We have a divergence between the Nasdaq & the % of stocks above their own 200d ma.

The % of stocks above the 200d ma was is now rising while the Nasdaq is still dropping.

Keep an eye on this because it's positive if it continues.

Breadth > Index

Breadth is a leading indicator The Last time we saw a divergence was in July 2021.

That's when the % of stocks above the 200d ma was going down while the Nasdaq was going up.

We all know how that turned out = breadth was a leading indicator.

Jan 5, 2023 5 tweets 1 min read
1/ Our 2022 Portfolio Performance:
- Index Funds: -18.4%
- Growth: -19.1%
- IRA: -31.2%
- Crypto: -46.6%

- $SPX -19.4%
- $COMPQ -33.1%
- $ARKK: -66.9%

5-Year Perf:
- Crypto Port: +237.4%
- Growth Port: +154.4%
- Index Funds: +55.7%
- IRA Port: +36.6%

S&P 5-yr Benchmark: 56.8% 2/ 2022 was a rough year for many, w/ the Nasdaq down 33%.

I should have done better, based on my sells in the fall of 2021.

Although I started to go to cash in the fall of 2021, I stubbornly held partial positions into the 1st qtr of 2022 & a few names throughout the year.
Dec 13, 2022 4 tweets 1 min read
Nov 30, 2022 9 tweets 3 min read
$CRWD - $112.20, made the lower low (2+ year low) that we have been questioning since the pattern setup back in May.

- Declining 200d ma
- Lower highs
- Lower lows
- Bear market
- High valuation
- Stage 4

No position. April 14th: $CRWD Stage 3
Sep 22, 2022 4 tweets 1 min read
This 👇 "In exactly the same way that the Fed was unable to spur inflation by cutting rates to exceptionally low levels, so will they be unable to contain inflation by hiking rates off these exceptionally low levels."
Sep 12, 2022 6 tweets 2 min read
🧵5 Stocks on the Watchlist

$ARRY
$PRVA
$GFS
$PCTY
$ANET

Looking at:
- EPS increasing
- Sales increasing
- Fund sponsorship increasing
- RS is strong

All charts via @MarketSmith $ARRY - $20.53

- EPS are positive & trending higher
- Sales are trending higher
- Fund sponsorship is flat (past 4 Qs)
- RS is 98
Jul 16, 2022 4 tweets 2 min read
Passive vs Active Investing

People always forget about costs, taxes and inflation when looking at real returns over time, they chop into returns in a big way, especially when compounding the end result.

4.8% annually vs 2.0% annually, over 30 years is a HUGE difference.

#Thorp Chart from A Man for All Markets by Thorp.

Another one:
Jun 7, 2022 4 tweets 2 min read
Michael Burry, of 'The Big Short' fame, compared the slowing housing market to 2008 saying it's like 'watching a plane crash'

👀🤷‍♂️ Image Mortgage demand falls to the lowest level in 22 years

Applications for a mortgage are 21% lower than the same week one year ago.

cnbc.com/2022/06/08/mor…
May 7, 2022 10 tweets 4 min read
🧵A comparison of drops for the % of stocks below their own 200d ma on the Nasdaq.

- 2001-02: long duration
- 2008: long duration
- 2018 & 2020: quick v-shaped
- 2022: long duration

Below 15% is the accumulate zone but ONLY when stage 1 & 2 bases are forming!

$COMPQ 2/ July 7th:

"Divergences on the charts:

The index is going up but the # of stocks above these averages is not.

Watch breadth."

Apr 3, 2022 4 tweets 2 min read
🧵March 2022 Portfolio Update:
*through April 3rd

Past Month Performance:
Crypto: +11.9%
IRA Acct: +3.70%
Growth Acct: +1.45%

YTD:
Crypto Act: -3.6%
IRA Act: -9.29% | Fully invested
Growth Act: -11.23% | 80.5% cash

$SPX -4.62%
$COMPQ -8.84%
$ARKK -28.6% 2/ Growth Account Holdings

-11.23% YTD
+1.45% past month
Cash: 80.5%

$PLTR 3.9%
$SQ 3.8%
$COIN 2.6%
$TDOC 2.1%
$SHOP 2.0%
$MQ 2.0%
$ROKU 1.8%
$RBLX 1.3%
Mar 30, 2022 15 tweets 4 min read
🧵Bear Flag Pattern

Stocks can often gain 100%+ on the move, quickly.

But notice the longer term trend & 200d ma.

Can these 12 beaten down stocks recover the 200d?
If so, how long will it take?

$ARKK is the group example

All 12 are still -35% to -65% below the 200d ma 2/ $PTON
Mar 27, 2022 8 tweets 4 min read
🧵Is a Perfect Storm brewing for a global famine?

"We believe we are at the onset of a global famine of historic proportions."

The populations most at risk... are half a world away & we worry that that number is uncomfortably high.

Must read @DoombergT

doomberg.substack.com/p/farmers-on-t… 2/ Fertilizer prices at record highs!

Key sources of nitrogen, potassium, and phosphorous – important inputs into soil fertility, crop yield, and plant maintenance – have all gone vertical.

Via: @DoombergT
Mar 22, 2022 6 tweets 2 min read
🧵Stock Chart Stage Analysis

5 examples of stocks that just went through stages 2, 3 and 4 (all currently in stage 4).

Ideal Buy: In Stage 2 (above 200d)
Ideal Sell: In Stage 4 (below 200d)

$TDOC
$PTON
$ZM
$RDFN
$ROKU 
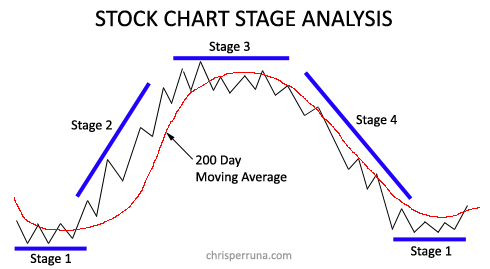
2/ $TDOC - currently in stage 4, well below the 200d ma.
Feb 15, 2022 26 tweets 7 min read
🧵25 Stocks Under the 200d ma

- COVID Growth Stars
- IPO: 2015-'21
- 11% to 52% below respective 200d ma
- Broken charts, need to recover

$ASAN $DOCN $U $NET $APPS $OKTA $CELH $RBLX $CRWD $COIN $SOFI $ETSY $ESTC $SHOP $RDFN $PLTR $UPST $TDOC $DOCU $ROKU $SQ $ZM $DKNG $FVRR $SE $ASAN - $68.66
-11.4% below the 200d ma
-52.9% off high
38.23 P/S