
Those following my recent #ClimateChangeNow threads will have seen a focus on the Tropical rain belt - specifically the impact of a string of hurricane's in the Eastern Pacific on increasing atmospheric water across the globe.
& on the impact in East Asia in particular.
& on the impact in East Asia in particular.
Altogether the Pacific has had six systems - five of which are hurricane's since May 22nd.
Since July 2nd there have been 3 (pictured below see also Wikipedia [en.wikipedia.org/wiki/2022_Paci….] - Bonnie 2/7, Darby 6/7 and Estelle 7/11.
Since July 2nd there have been 3 (pictured below see also Wikipedia [en.wikipedia.org/wiki/2022_Paci….] - Bonnie 2/7, Darby 6/7 and Estelle 7/11.


Two more are now predicted in the GFS supercomputer weather model, and they will become Frank and Georgette if they appear.
As you will see in the next tweet the system which is expected to become Frank is already forming.
The first forecast image below shows Frank on July 26th. The second image shows what could become Georgette on July 29th.
The first forecast image below shows Frank on July 26th. The second image shows what could become Georgette on July 29th.


This is our first glimpse of the tropical disturbance which could soon become Frank. It has not yet been designated by the NHC (National Hurricane Center) which currently says there is a 30% chance of formation of a storm in this area over five days.
As the forecast system has not yet been designated we do not yet have floater satellite imagery. But the 3rd & 4th images here are current satellite imagery from Goes East >> star.nesdis.noaa.gov/goes/sector.ph…
The NHC text for this is very sparse at this stage.
The NHC text for this is very sparse at this stage.


This computer similarion image shows the atmospheric water forecast for #Frank and #Georgette. Both are currently expected to become like their three sibling storms - all of which originated in roughly the same spot - significant storms.
These two graphics from the Wikipedia page show the origination point and the relative strengths of the first three storms in this series.


Whilst Hurricane Darby has had some pretty spectacular impacts in Hawaii these storms are not expected to be a particular hazard to land, though there outflows are generating storms on the American mainland. This image shows Estelle three days ago.

The main impact here is on the tropical water balance - and this impact is global.
All three hurricanes have generated significant outflows strengthening the flow of water westwards along the main Tropical Rain Band. In this image (17/7) we see Estelle (nth) and Darby (sth).
All three hurricanes have generated significant outflows strengthening the flow of water westwards along the main Tropical Rain Band. In this image (17/7) we see Estelle (nth) and Darby (sth).

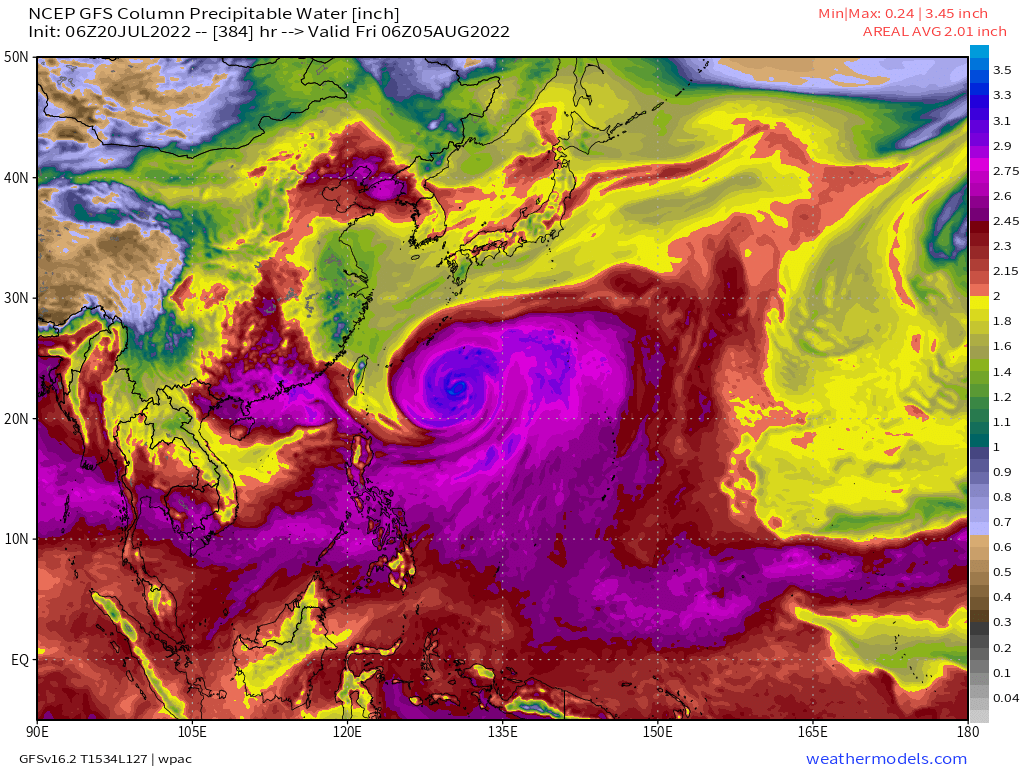
This forecast shows the expected impact of Frank and Estelle on that tropical water flow. Thanks to the earlier hurricane's this flow is running hot, not with standing the La Nina (low SST temperatures) in the Eastern Pacific.
And this is forecast to have significant impacts in the West Pacific, India and probably also East Africa as the water propagates eastwards.
Perhaps because cyclones are inherently very hard to forecast beyond 3 days with any confidence, the longer range model prognostications are extremely varied. We can see this in the current spaghetti graphics for the East and West Pacific.


Here three forecast solutions in recent model runs.
1. Today
2 & 3. Yesterday
1. Today
2 & 3. Yesterday


The next series of images in this #ClimateChangeNow thread look at the global impact of this phenomena - which is now already three weeks old - and IMO already having significant impacts, varied, as far West as India and Africa.
Here we see the 24h over the East Pacific 1/6
Here we see the 24h over the East Pacific 1/6
The animation above shows the impact of the outflows from Estelle into the Westwards travelling tropical rain band.
And SST anomaly image 18/7 (See coralreefwatch.noaa.gov/product/5km/ for data/animations) appears to show a localised impact from the hurricanes on SSTs themselves.
And SST anomaly image 18/7 (See coralreefwatch.noaa.gov/product/5km/ for data/animations) appears to show a localised impact from the hurricanes on SSTs themselves.

The large area of blue you see in the image above is the La Nina = unusually low SSTs over a vast area of the Pacific.
This image shows the next leg of Westward travel across the Pacific. Again 24h. on the LHS, in the area NE of Australia it looks as if there is an impediment.
This image shows the next leg of Westward travel across the Pacific. Again 24h. on the LHS, in the area NE of Australia it looks as if there is an impediment.
And here's a close up view of that - over the last six hours.
This is a 72 hour forecast for this area. Water moving simultaneously in different directions at different altitudes. A substantial amount of water is heading north and combining into a stream coming past Japan into a colossal atmospheric river heading towards Alaska.
Same data with a clearer view of the net flows as predicted by the model. The quoted thread shows what is predicted to happen to this atmospheric river. Part of it eventually curves south bringing some of the water back.
https://twitter.com/althecat/status/1549747288788066306?s=20&t=K8be_VrUL23zT69TmjA3fA
Moving west again we find SEA. lots of rapid tropical water flow and convection, including a low system over or off the coast of Vietnam which is generating a lot of rainfall.
But the main feature is a lot of water passing through towards the Indian Ocean.
But the main feature is a lot of water passing through towards the Indian Ocean.
And in the Indian Ocean convection is also picking up generating very high elvels of rainfall over the Ethiopian highlands where atmospheric water from the SE is coliding with flows from the NE coming in over the Arabian Peninsula.
We can also see a very busy picture in the West African Monsoon. over the Sahel and the great central African Rain Forest - and in the evening over the Sahara Desert. #DesertRain
And finally to complete our tropical river picture here is a view of the final leg over the Atlantic and the Northern Amazon.
Can any conclusions be made from all this?
Image 1: The average no. of hurricanes in the EPAC is 8. So far there have been 5. If Frank/Georgette spin up that will make 7.
Image 2 & 3: In 1992 (the record year) there were 6 before the end of July.
Image 1: The average no. of hurricanes in the EPAC is 8. So far there have been 5. If Frank/Georgette spin up that will make 7.
Image 2 & 3: In 1992 (the record year) there were 6 before the end of July.


Broadly speaking rain correlates to El Nino - Drought to La Nina. La Nina conditions are more common & 2022 is La Nina .
Pacific Hurricane record yrs (1990, 1992, 2014 & 2015) are be El Nino or Neutral years.
en.wikipedia.org/wiki/El_Ni%C3%…
Pacific Hurricane record yrs (1990, 1992, 2014 & 2015) are be El Nino or Neutral years.
en.wikipedia.org/wiki/El_Ni%C3%…


Do El Nino EPAC Hurricanes correlate with WPAC typhoons?
Img 1 & 2: 2016 Season (Strong EN)
Img 3 & 4: 1998 Season (strong EN)
Img 1 & 2: 2016 Season (Strong EN)
Img 3 & 4: 1998 Season (strong EN)


Do La Nina EPAC Hurricanes correlate with WPAC typhoons?
Img 1 & 2: 2012 Season (Strong LN)
Img 3 & 4: 2001 Season (strong LN)
Img 1 & 2: 2012 Season (Strong LN)
Img 3 & 4: 2001 Season (strong LN)


On the face of it the answer seems to be yes to both questions. But maybe there is just an increase in both as temperatures are rising.
The question I am really seeking to answer here is whether La Nina's are no longer as closely correlated as they were with droughts, because as the water carrying capacity of the atmosphere increases, something looking like El-Nino in terms of atmospheric water is now normal.
As for this year, it remains to be seen. But it looks as it it is shaping up to be a record year for Pacific Hurricanes and Typhoons. Theres an interesting blog about this general question here from 2014. climate.gov/news-features/…
Simply put, El Niño favors stronger hurricane activity in the central and eastern Pacific basins, and suppresses it in the Atlantic basin (Figure 1)

Conversely, La Niña suppresses hurricane activity in the central and eastern Pacific basins, and enhances it in the Atlantic basin (Figure 2).

But this is not what we are currently seeing happening. We have La Nina, a fairly strong one.
But as of right now no Atlantic Hurricanes at all. But five and counting Pacific Hurricanes.
But as of right now no Atlantic Hurricanes at all. But five and counting Pacific Hurricanes.


• • •
Missing some Tweet in this thread? You can try to
force a refresh


