Lyn Alden on the Global Energy Crisis, the US Dollar Wrecking Ball and the Fed Pivot.
@LynAldenContact summarizes major macro themes and how the Fed may respond and impact the economy and financial markets.
Here are notes on her macro masterclass 🧵👇
@LynAldenContact summarizes major macro themes and how the Fed may respond and impact the economy and financial markets.
Here are notes on her macro masterclass 🧵👇

@LynAldenContact This thread summarizes a recent interview with @LynAldenContact and @MikeIppolito_.
Link:
Contents
• 3/ Global Energy Crisis
• 17/ The Rise of the US Dollar
• 21/ How much can the Fed tighten?
• 28/ Long Term Debt Cycle
• 33/ Outlook for the decade
Link:
Contents
• 3/ Global Energy Crisis
• 17/ The Rise of the US Dollar
• 21/ How much can the Fed tighten?
• 28/ Long Term Debt Cycle
• 33/ Outlook for the decade
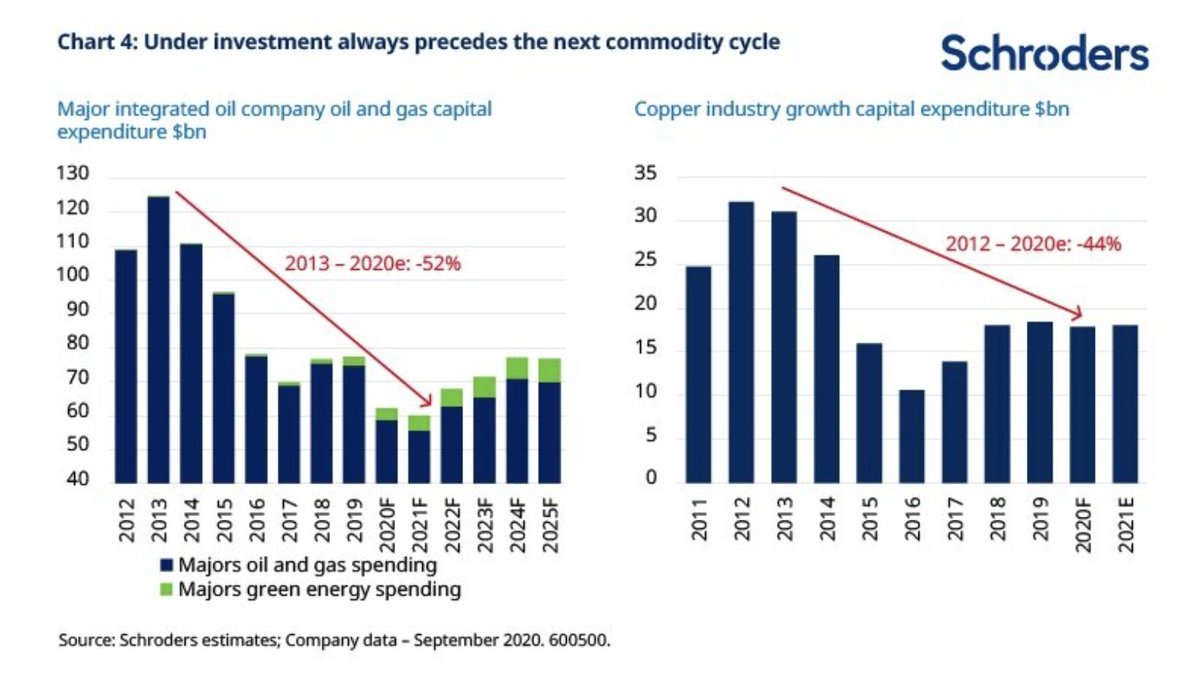
@LynAldenContact @MikeIppolito_ 3/ Lyn begins with a discussion on energy - the master commodity.
Energy and commodities in general go through long CapEx cycles.
The reason for this is that building energy infrastructure (transport, refining, etc) is expensive and takes years.
Energy and commodities in general go through long CapEx cycles.
The reason for this is that building energy infrastructure (transport, refining, etc) is expensive and takes years.
@LynAldenContact @MikeIppolito_ This leads to periods of underinvestment in commodity infrastructure when prices are low.
But, over time, demand picks up and prices increase as capacity gets used up.
This creates more need for greater investment in energy / commodity infrastructure.
But, over time, demand picks up and prices increase as capacity gets used up.
This creates more need for greater investment in energy / commodity infrastructure.
@LynAldenContact @MikeIppolito_ Producers have low pricing power, so builders need to make sure that demand & price will stay elevated so that it is worthwhile to invest in expanding supply.
Now, in 2022, commodities are priced high, but supply is low due to underinvestment over the last five years.
Now, in 2022, commodities are priced high, but supply is low due to underinvestment over the last five years.
@LynAldenContact @MikeIppolito_ During the past 5 years, commodity prices were low - disincentivizing investment in this space.
ESG regulation also drove away capital markets since they affected profitability for oil producers.
Hence, capacity is dwindling, even for big players like the OPEC+ nations.
ESG regulation also drove away capital markets since they affected profitability for oil producers.
Hence, capacity is dwindling, even for big players like the OPEC+ nations.
@LynAldenContact @MikeIppolito_ Russia - Ukraine
Even before the war, gas prices in EU were shooting up in '21 (much faster than oil prices) due to structural undersupply from years of low investment.
Constraints on EU's natural gas supply due to the Russia - Ukraine war worsened an already bad situation.
Even before the war, gas prices in EU were shooting up in '21 (much faster than oil prices) due to structural undersupply from years of low investment.
Constraints on EU's natural gas supply due to the Russia - Ukraine war worsened an already bad situation.
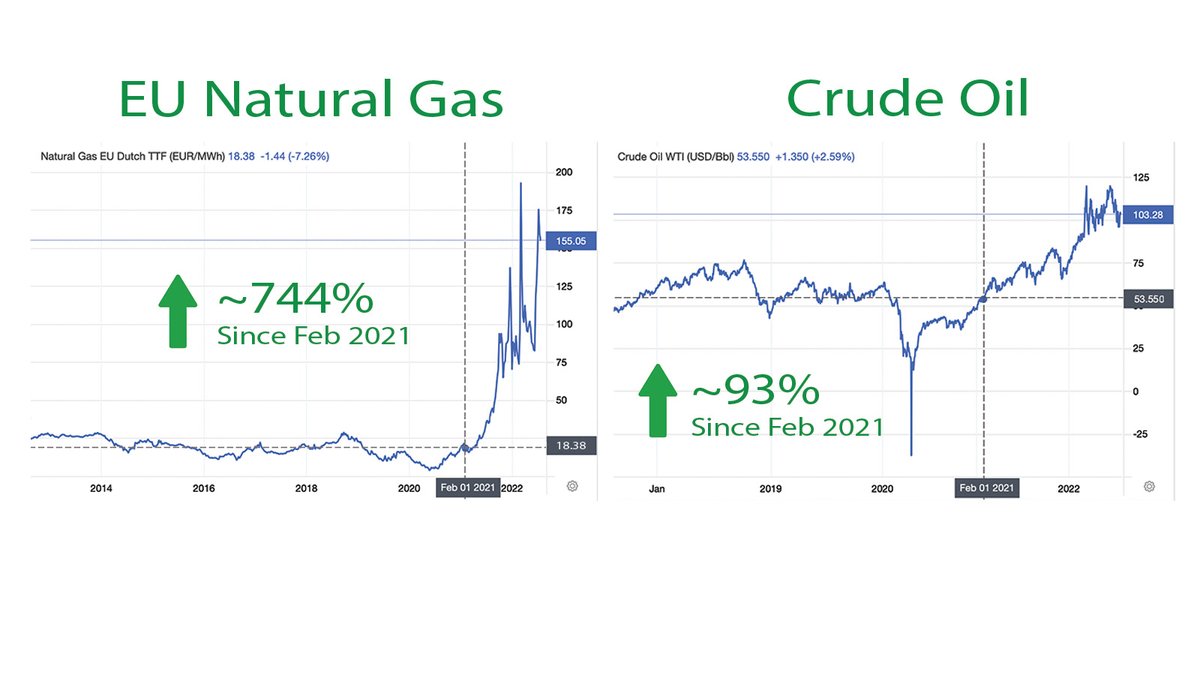
@LynAldenContact @MikeIppolito_ Crude Oil vs Natural Gas
Crude oil is more fungible. It is much easier to transport barrels of oil across the world.
Natural gas requires major investments in pipeline infrastructure to transfer between countries - this is why the EU can't just simply replace Russian gas.
Crude oil is more fungible. It is much easier to transport barrels of oil across the world.
Natural gas requires major investments in pipeline infrastructure to transfer between countries - this is why the EU can't just simply replace Russian gas.
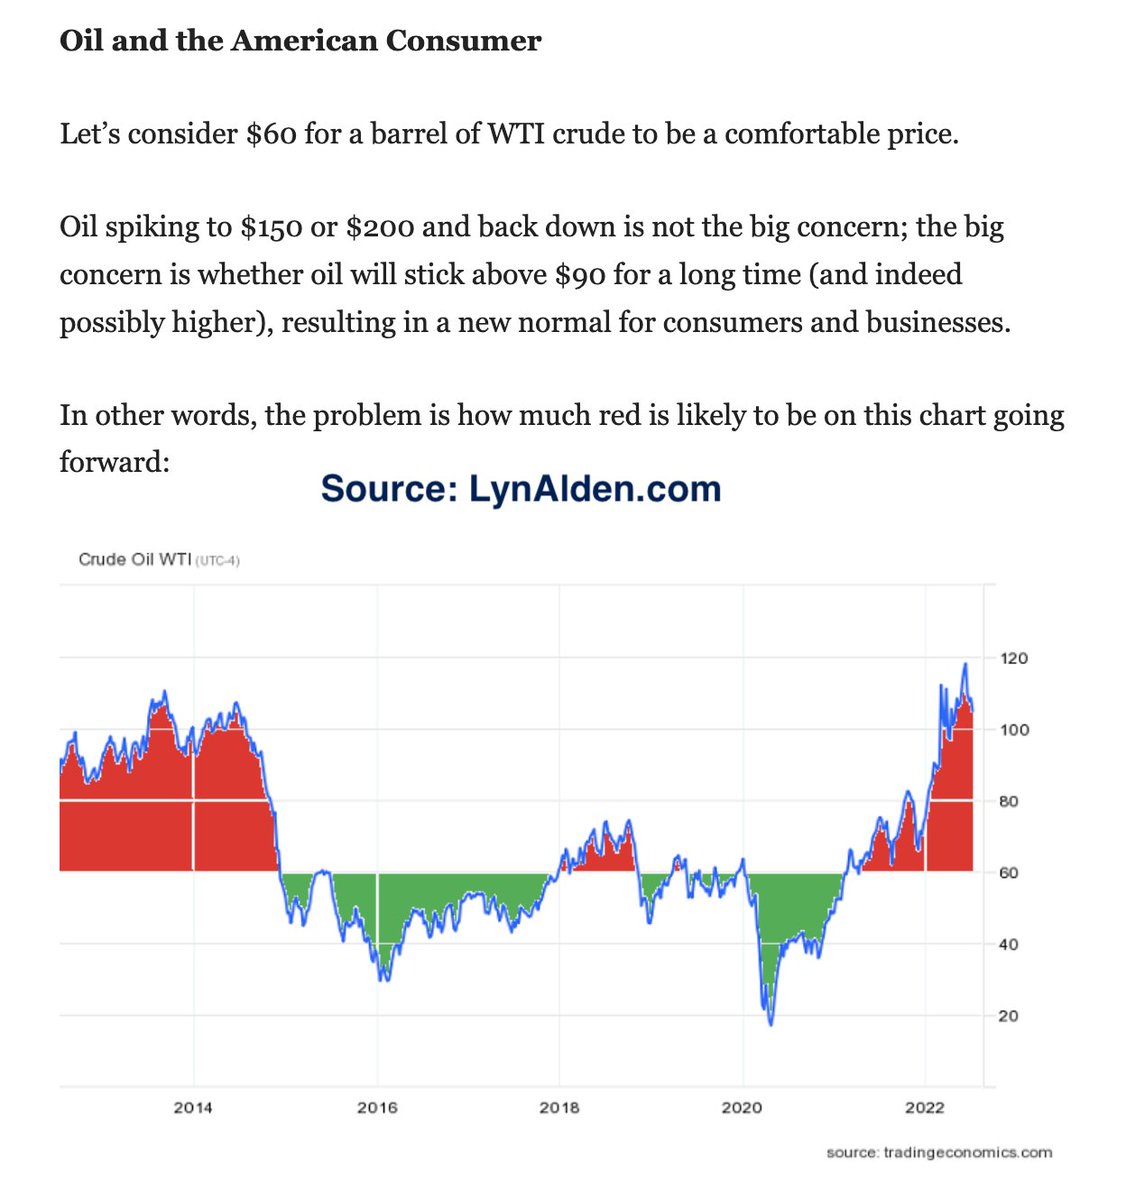
@LynAldenContact @MikeIppolito_ The energy problem is not just about how high prices can get to, but about how long they remain elevated for as well.
Lyn describes this as the "area under the curve."
More specifically, this is the integral of the energy price curve, which includes price and time as factors.
Lyn describes this as the "area under the curve."
More specifically, this is the integral of the energy price curve, which includes price and time as factors.
@LynAldenContact @MikeIppolito_ 10/ Even if energy prices move sideways at current levels for a long time, there would be a big strain on the economy.
Consumers around the world would suffer if oil prices stay high.
Natural gas, on the other hand, would put more strain on both households and manufacturing.
Consumers around the world would suffer if oil prices stay high.
Natural gas, on the other hand, would put more strain on both households and manufacturing.
@LynAldenContact @MikeIppolito_ This is because natural gas has a higher effect on electricity production and prices, which directly impacts manufacturing competitiveness.
European manufacturing would be particularly hit.
Not having cheap energy is one of the biggest disadvantages any company can have.
European manufacturing would be particularly hit.
Not having cheap energy is one of the biggest disadvantages any company can have.
@LynAldenContact @MikeIppolito_ Technology Deflation vs Commodity Inflation
Over time, things should get cheaper relative to income due to technological advances.
Ex: Machinery like tractors have led to a smaller percentage of people needing to work as farmers, making food less expensive & more available.
Over time, things should get cheaper relative to income due to technological advances.
Ex: Machinery like tractors have led to a smaller percentage of people needing to work as farmers, making food less expensive & more available.
@LynAldenContact @MikeIppolito_ However, the effects of cheaper food and lower cost of living are undermined when commodity prices go up.
Commodities are needed to create these deflationary technologies.
Ex: Natural gas is an input cost for fertilizers - so when gas prices rise, so does the cost of food.
Commodities are needed to create these deflationary technologies.
Ex: Natural gas is an input cost for fertilizers - so when gas prices rise, so does the cost of food.
@LynAldenContact @MikeIppolito_ Most energy grids in the west are powered by natural gas, whereas coal is used primarily to power grids in Asia.
Most plastic in the world also come from hydrocarbons derived from crude oil & natural gas.
Not only is there pain in the pump - there is pain in everything.
Most plastic in the world also come from hydrocarbons derived from crude oil & natural gas.
Not only is there pain in the pump - there is pain in everything.
@LynAldenContact @MikeIppolito_ 15/ High input costs suck out discretionary income and efficiency.
We end up needing to spend more to meet our basic needs.
This is all feeds into wage inflation.
Skilled laborers like technicians will charge more for their services as their cost of living rises.
We end up needing to spend more to meet our basic needs.
This is all feeds into wage inflation.
Skilled laborers like technicians will charge more for their services as their cost of living rises.
@LynAldenContact @MikeIppolito_ Cost structures for businesses will be impacted.
With higher input costs and wages, companies will pass on higher prices to consumers.
Corporate margins get squeezed, resulting in lower equity prices.
Lyn expects real earnings for many sectors to surprise on the negative side.
With higher input costs and wages, companies will pass on higher prices to consumers.
Corporate margins get squeezed, resulting in lower equity prices.
Lyn expects real earnings for many sectors to surprise on the negative side.
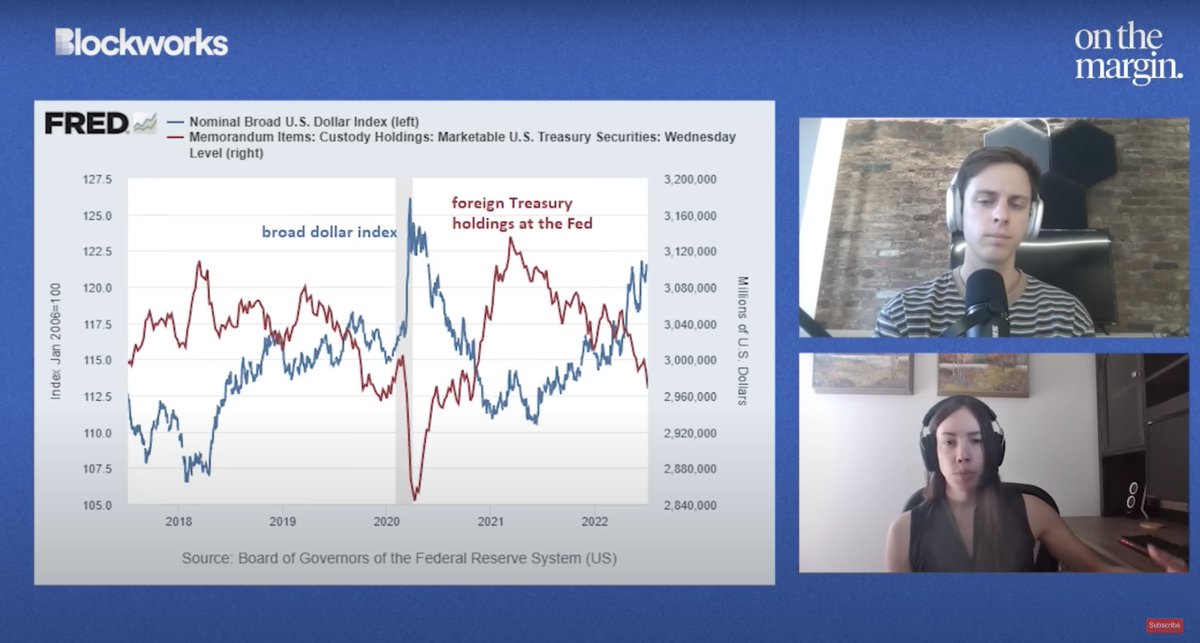
@LynAldenContact @MikeIppolito_ 17/ The Rise of the US Dollar
Rising dollar strength puts a strain on global trade, and can even have adverse effects that ricochet back to the US.
Foreign investors and other Central Banks generally stop buying US Treasuries or even sell them to increase their dollar reserves.
Rising dollar strength puts a strain on global trade, and can even have adverse effects that ricochet back to the US.
Foreign investors and other Central Banks generally stop buying US Treasuries or even sell them to increase their dollar reserves.
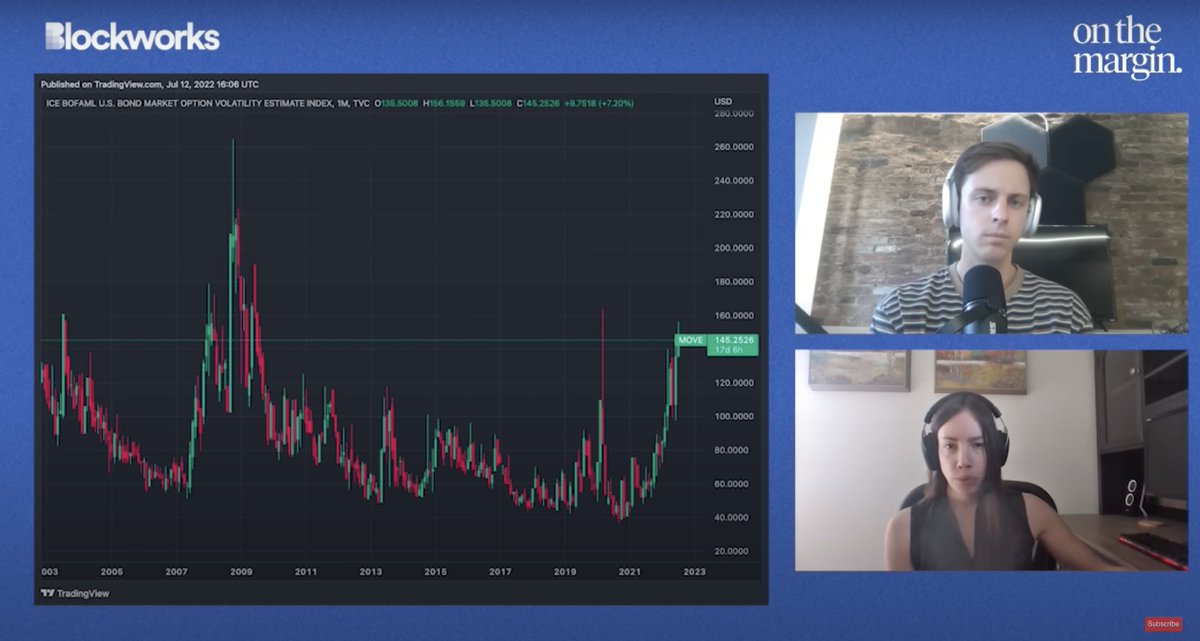
@LynAldenContact @MikeIppolito_ This has translated to unusually low liquidity and high volatility in the US treasury market.
The MOVE index, sometimes referred to as the VIX for bonds, has reached levels similar to March 2020.
The MOVE index, sometimes referred to as the VIX for bonds, has reached levels similar to March 2020.
@LynAldenContact @MikeIppolito_ USD Strength & Corporate Earnings
~40% of S&P 500 companies' revenues come from other countries.
Int'l revenues convert to fewer dollars as USD strengthens relative to other currencies.
A stronger dollar also makes importing from the US more expensive for foreign consumers.
~40% of S&P 500 companies' revenues come from other countries.
Int'l revenues convert to fewer dollars as USD strengthens relative to other currencies.
A stronger dollar also makes importing from the US more expensive for foreign consumers.
@LynAldenContact @MikeIppolito_ As a result, a stronger dollar can squeeze corporate earnings.
Corporate underperformance leads to wider credit spreads.
These spreads on top of increasing Treasury yields makes the cost of capital go up for businesses.
This makes borrowing more expensive for corporations.
Corporate underperformance leads to wider credit spreads.
These spreads on top of increasing Treasury yields makes the cost of capital go up for businesses.
This makes borrowing more expensive for corporations.
@LynAldenContact @MikeIppolito_ 21/ How much can the Fed tighten?
Lyn argues that withdrawing liquidity will be painful.
Over decades, the US govt. has accumulated a lot of debt (~130% of GDP) that relies on low interest rates.
As rates rise, so do debt servicing costs for gov't, businesses and households.
Lyn argues that withdrawing liquidity will be painful.
Over decades, the US govt. has accumulated a lot of debt (~130% of GDP) that relies on low interest rates.
As rates rise, so do debt servicing costs for gov't, businesses and households.
@LynAldenContact @MikeIppolito_ This makes it hard for gov't, business & household balance sheets to absorb positive real rates on a long term basis.
On the political side, voter push back also adds friction and makes it harder to tighten for prolonged periods of time.
On the political side, voter push back also adds friction and makes it harder to tighten for prolonged periods of time.
@LynAldenContact @MikeIppolito_ The Fed can tighten until a couple things happen:
1. Outright Deep Recession
2. Broken Credit Markets (can't refinance existing debt with new debt because rates are too high)
3. Treasury Market Freezes - illiquidity due to decreased demand and increased supply of Treasuries.
1. Outright Deep Recession
2. Broken Credit Markets (can't refinance existing debt with new debt because rates are too high)
3. Treasury Market Freezes - illiquidity due to decreased demand and increased supply of Treasuries.
@LynAldenContact @MikeIppolito_ Lyn goes into detail on the Treasury market, because if it is broken, it would be "checkmate" for the Fed.
Right now, problems in the Treasury market are not "marked-to-market."
Net issuance of Treasury debt was relatively low in Q2 and Q3 of last year.
Right now, problems in the Treasury market are not "marked-to-market."
Net issuance of Treasury debt was relatively low in Q2 and Q3 of last year.
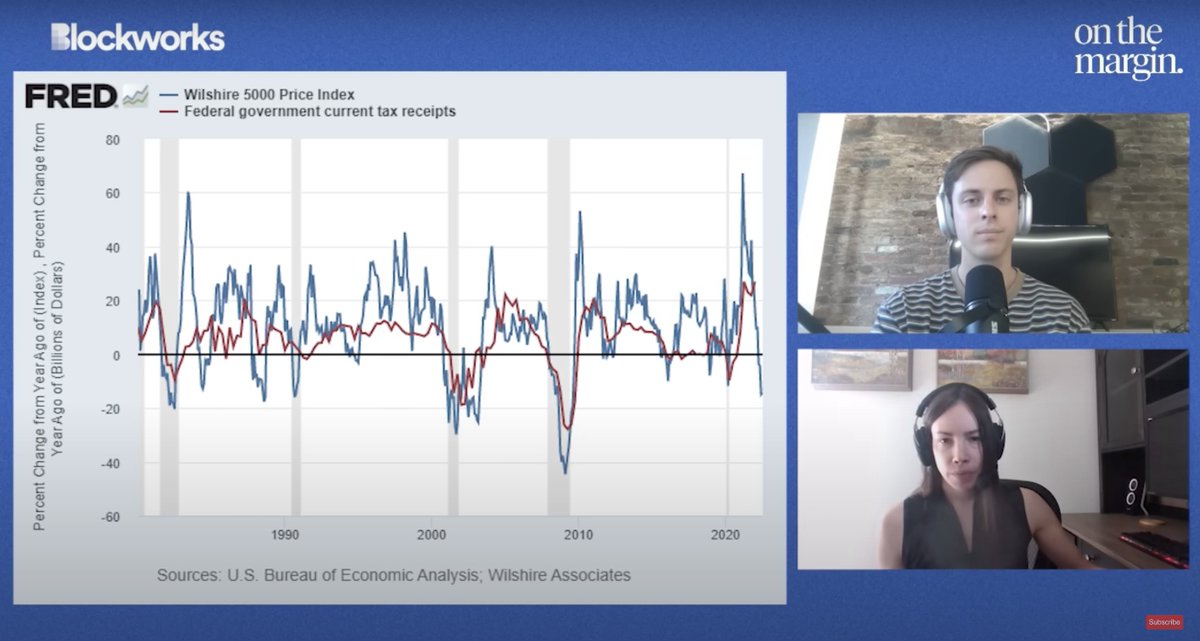
@LynAldenContact @MikeIppolito_ 25/ An important reason for this is that last year's tax revenues were high due to an inflated stock market.
Stock prices and tax revenues are quite strongly correlated.
If tightening continues and asset prices keep falling, future tax revenues will continue to fall.
Stock prices and tax revenues are quite strongly correlated.
If tightening continues and asset prices keep falling, future tax revenues will continue to fall.
@LynAldenContact @MikeIppolito_ As tax revenue falls, the government would need to run a deficit and more debt would need to be issued.
This should lead to an oversupply of Treasuries at a time when demand from foreign investors is low.
This can lead to issues with liquidity, volatility and yields.
This should lead to an oversupply of Treasuries at a time when demand from foreign investors is low.
This can lead to issues with liquidity, volatility and yields.
@LynAldenContact @MikeIppolito_ The Fed may then need to step in and re-liquify the market by buying government debt.
They can also relax SLR rules to encourage banks to buy more Treasuries.
Hence, we can see why fiscal constraints are an example of a structural limit that could halt financial tightening.
They can also relax SLR rules to encourage banks to buy more Treasuries.
Hence, we can see why fiscal constraints are an example of a structural limit that could halt financial tightening.
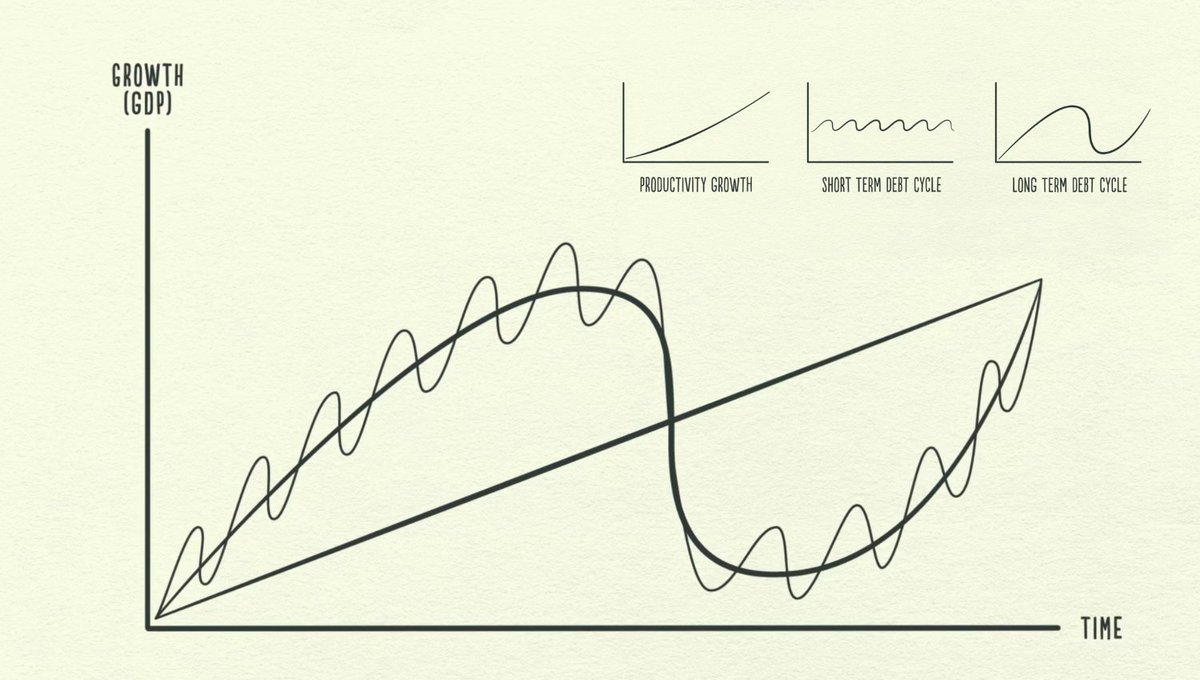
@LynAldenContact @MikeIppolito_ 28/ Long-Term Debt Cycle
Lyn suggests Ray Dalio's long-term debt cycle thesis as a good framework to understand the current situation.
We've written an explainer on this thesis before - linked below
Lyn suggests Ray Dalio's long-term debt cycle thesis as a good framework to understand the current situation.
We've written an explainer on this thesis before - linked below
https://twitter.com/FinTwitNotes/status/1539228197811679233
@LynAldenContact @MikeIppolito_ Lyn's argument is that high levels of debt and wealth concentration have created an environment where median income earners are fragile to shocks in the system.
For example: the pandemic lockdowns elicited a response of trillions of dollars of stimulus and money printing.
For example: the pandemic lockdowns elicited a response of trillions of dollars of stimulus and money printing.
@LynAldenContact @MikeIppolito_ Since the median population had a lot of debt relative to income, they were prone to insolvency when they were locked in and unable to earn money.
If wealth was spread more evenly, massive inflationary fiscal responses would not be needed as much to protect these households.
If wealth was spread more evenly, massive inflationary fiscal responses would not be needed as much to protect these households.
@LynAldenContact @MikeIppolito_ 31/ How do long-term debt cycles resolve?
Usually through a major currency devaluation.
When debt to GDP is too high, Central Banks are unable to reverse this by raising rates.
So governments must turn to fiscal stimulus, leading to an inflationary environment.
Usually through a major currency devaluation.
When debt to GDP is too high, Central Banks are unable to reverse this by raising rates.
So governments must turn to fiscal stimulus, leading to an inflationary environment.

@LynAldenContact @MikeIppolito_ If inflation is roaring and rates are near 0, then rates are forced to move sideways or up.
Government debt becomes untenable and needs to be defaulted on.
If debts are in their own currency, they can default in real terms through currency devaluation. (Haircuts for everyone).
Government debt becomes untenable and needs to be defaulted on.
If debts are in their own currency, they can default in real terms through currency devaluation. (Haircuts for everyone).
@LynAldenContact @MikeIppolito_ 33/ Outlook for this decade
While commodity prices were not a large focus over the last 5 years, Lyn believes they will be very relevant this decade.
She believes we'll see higher than average inflation, but interest rates will be lower than inflation due to how high debts are.
While commodity prices were not a large focus over the last 5 years, Lyn believes they will be very relevant this decade.
She believes we'll see higher than average inflation, but interest rates will be lower than inflation due to how high debts are.
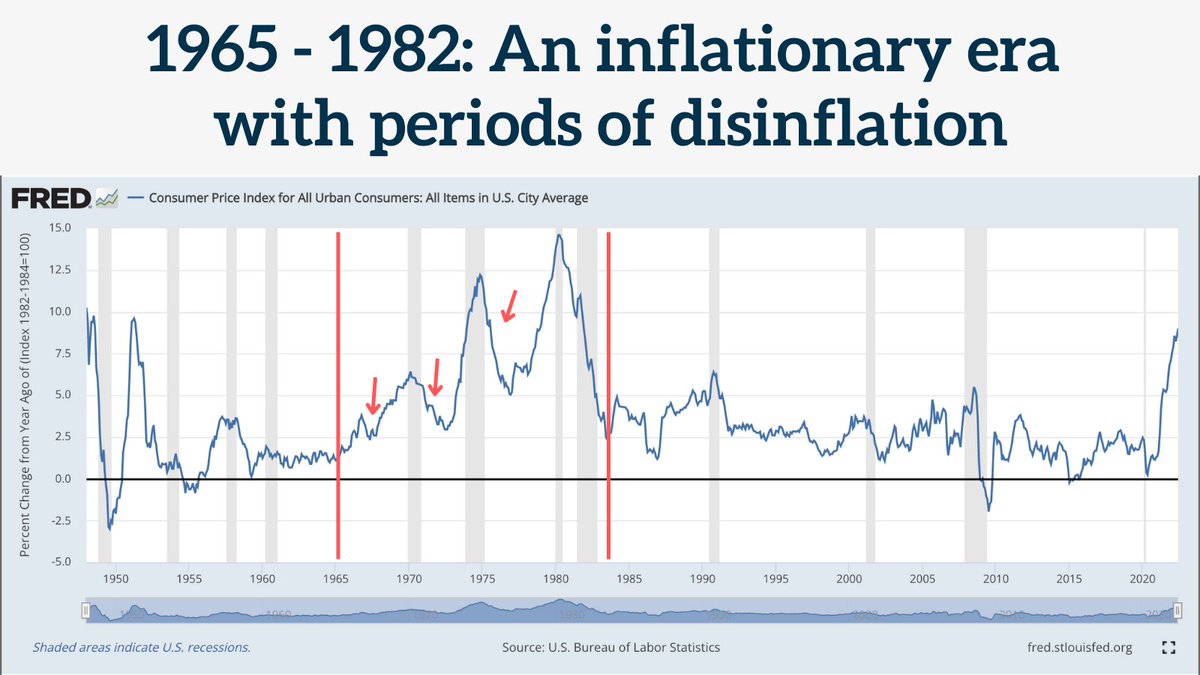
@LynAldenContact @MikeIppolito_ While the decade will generally be inflationary, Lyn argues there will be disinflationary periods mixed in.
Why?
Policymakers have mandates and legacies and are unlikely to inflate debt away in one go.
Disinflationary push-backs happened in the 70s and 40s too.
Why?
Policymakers have mandates and legacies and are unlikely to inflate debt away in one go.
Disinflationary push-backs happened in the 70s and 40s too.
@LynAldenContact @MikeIppolito_ But the core inflationary issue is that energy's structurally undersupplied (production, transportation & refining).
Temporarily suppressing demand can make some inflationary pressures relax but it's not sustainable.
Supply side problems need to be addressed, which takes years.
Temporarily suppressing demand can make some inflationary pressures relax but it's not sustainable.
Supply side problems need to be addressed, which takes years.
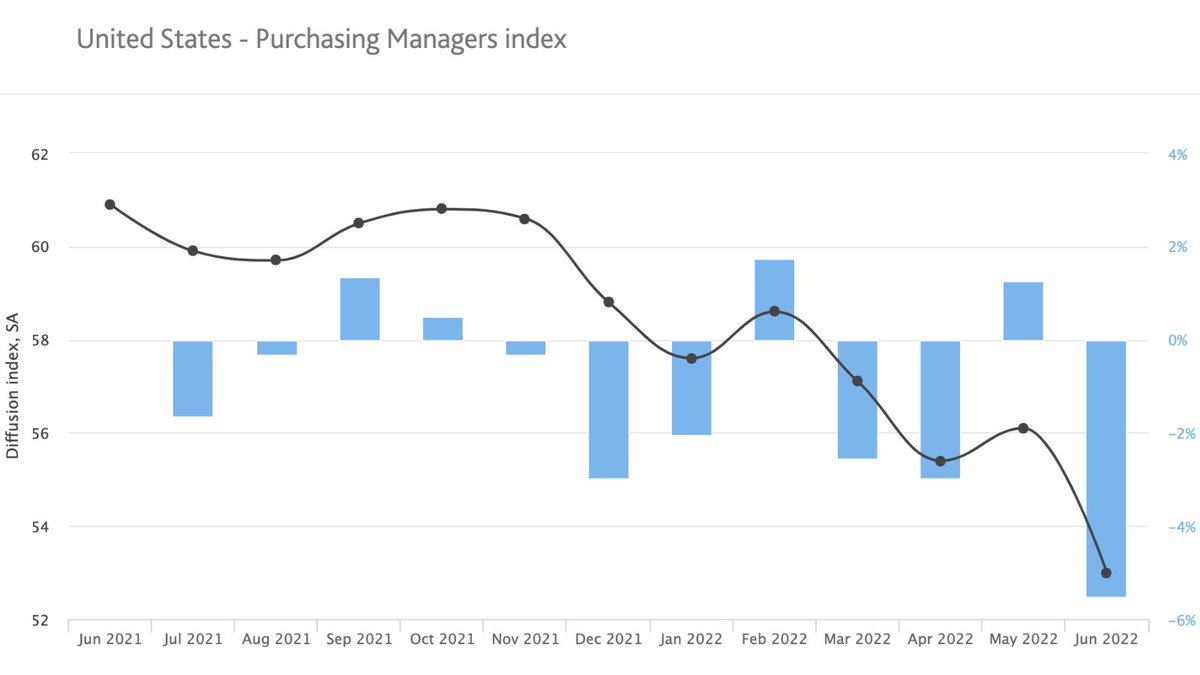
@LynAldenContact @MikeIppolito_ Lyn discusses gold vs bitcoin.
Gold and cash hold up better in declining PMI environments.
Equities and bitcoin are more favorable when PMI is rising.
Rising PMI can be thought of as economic acceleration and declining PMI as economic deceleration.
Gold and cash hold up better in declining PMI environments.
Equities and bitcoin are more favorable when PMI is rising.
Rising PMI can be thought of as economic acceleration and declining PMI as economic deceleration.
@LynAldenContact @MikeIppolito_ We've been in a declining PMI environment for over a year now.
It's hard for anything other than dollars and possibly gold to do well in these conditions.
But - eventually Fed will need to reverse and many other assets can end up doing well.
It's hard for anything other than dollars and possibly gold to do well in these conditions.
But - eventually Fed will need to reverse and many other assets can end up doing well.
@LynAldenContact @MikeIppolito_ At some point, the Fed will enter a new regime where it is unable to tighten in the face of inflation.
This is already happening with Japan (250% debt to GDP) and Europe (countries like Italy have 150% debt to GDP)
In both cases there is a sharp currency devaluation.
This is already happening with Japan (250% debt to GDP) and Europe (countries like Italy have 150% debt to GDP)
In both cases there is a sharp currency devaluation.
@LynAldenContact @MikeIppolito_ That's the summary!
Thanks to @MikeIppolito_ and @LynAldenContact for the insights and discussion.
Special thanks to @OnTheMarginPod and @Blockworks_ for hosting and producing the episode.
Watch the full interview - it's worth it:
Thanks to @MikeIppolito_ and @LynAldenContact for the insights and discussion.
Special thanks to @OnTheMarginPod and @Blockworks_ for hosting and producing the episode.
Watch the full interview - it's worth it:
We'll be regularly sharing our notes and research across various topics in finance.
The financial world is complex, and we aim to produce content that is valuable to readers of all levels.
A follow, like and retweet👇is greatly appreciated!
The financial world is complex, and we aim to produce content that is valuable to readers of all levels.
A follow, like and retweet👇is greatly appreciated!
https://twitter.com/FinTwitNotes/status/1550098038688845824?s=20&t=miqSa9Mkt6V0MJDxFcgDQg
• • •
Missing some Tweet in this thread? You can try to
force a refresh