Jonathan Harrier, CMT Profile picture
Jul 23, 2022 9 tweets 3 min read Read on X
#Capitulation is not well understood. It means massive selling, where the bulk of likely sellers give up, en masse.
It does not usually mean "the bottom".
It does not require a $VIX jump or spiking put/call ratio.
Mid-June has many examples. Here are some...
(Thread 👇)
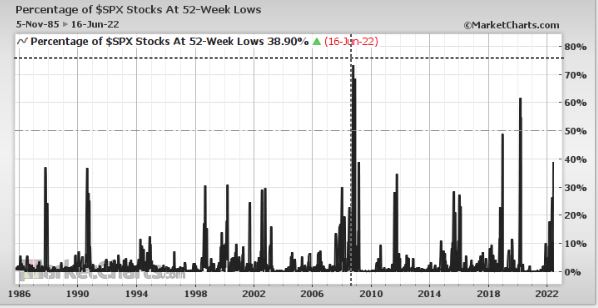
Capitulation example #1:
Spike in 52-wk lows
$SPX new lows hit 42% on June 16, closed at 39%. Only 16 lower readings since 1985.
Capitulation example #2:
Massive $NYA NYSE Composite down volume
98.5% June 13
96.3% June 16
Capitulation example #3:
49% of $SPX stocks had declined 5+ consecutive days as of June 14. Only a couple other higher readings back to 1985.
Capitulation example #4:
52-wk High-Low for $SPX stocks was -39% on June 16
Capitulation example #5:
7% of $NDX $QQQ stocks were above their respective 200-day MA on June 16.
Capitulation example #6:
$SPX $SPY 5-day Rate of Change < -10%
Capitulation example #7:
You can see capitulation visually via candlestick charting. Multiple massive bearish candles with gaps in between means no support. The waterfall decline is unrelenting selling. $SPX $SPY lost 12% in a week.
This is not an exhaustive list. There are many similar examples across indices. Feel free to share yours...

• • •

Missing some Tweet in this thread? You can try to force a refresh
 

Keep Current with Jonathan Harrier, CMT

Jonathan Harrier, CMT Profile picture

Stay in touch and get notified when new unrolls are available from this author!

Read all threads

This Thread may be Removed Anytime!

PDF

Twitter may remove this content at anytime! Save it as PDF for later use!

Try unrolling a thread yourself!

how to unroll video
  1. Follow @ThreadReaderApp to mention us!

  2. From a Twitter thread mention us with a keyword "unroll"
@threadreaderapp unroll

Practice here first or read more on our help page!

More from @jonathanharrier

Feb 28, 2023
Today:
1) $VIX crossed below its 50-ma but is still > 20
2) $VIX 50-ma is < 200-ma
3) $SPX is > 200-ma

First time in a year.

$SPX 3 months later, past 20 years (N=16)
100% were higher
+8.1% avg gain
-1.9% avg drawdown
+9.6% avg max gain over the 3 months

Event details 👇
Full study details can be seen via the backtest I ran using @MarketCharts
marketcharts.com/page/57f01dc4
And obviously I forgot what year it is...this occurrence today would be the first sequence of the events in nearly *two* years (March 9, 2021 was the last)
Read 4 tweets
Aug 14, 2022
Rare breadth thrust on $SPX: Only 6 prior times (since 1985) when...

Fewer than 10% of $SPX stocks were under their 50-MA, then jumped to 90% above within 2 months

Avg returns of 23% a year later, but the very low interim drawdowns of -2.8% are the thing to see. 👇
1/3
$SPY
Items of note:
1) Not a statistically significant sample size, but all were higher after 3 months
2) R:R out a year is 8.2x
3) The low after 4/29/09 was Day 1
4) The low after 5/26/20 was Day 12 (not a typo)
See event specifics in table I ran via @MarketCharts below.
2/3
Some will surely say "yeah but we've never had a situation like this, with inflation, the Fed" etc. Every one of these prior events came from times when "We've never had..." GET OVER IT, and learn from similar events of awful sentiment turning into breadth thrust.
3/3
Read 4 tweets
Jul 1, 2022
I’m reading through Technical Analysis of Stock Trends (Edwards & Magee) 7th Ed, 1998. The first edition came out in 1948. This thread contains book notes, excerpts, interesting bits.
“The stock market goes right on repeating the same old movements and much the same routine.” Image
The first edition came out <20 years after the Crash of 1929. Editions after included the prior charts from the boom & bust leading up to & after and are excellent for learning history of crazed euphoria and despair. It does remind me of ‘98-02 in particular. #Study the action.
Read 17 tweets
Dec 11, 2021
It's unfortunate how many on Twitter (even from notable names) only use Advance/Decline metrics as the only measure of breadth. Don't be so short-sighted that you miss opportunities. Study, learn, and apply for yourself. There are so many other breadth measures... $SPX $SPY 1/
Very strong breadth when considering that the % of $SPX stocks above their 10-day moving average just went from below 10% to 90% in less than 10 days. 2/ marketcharts.com/page/e5d862dd
Strong move in % of $SPX stocks advancing, from below 10% to 90% in a short period of time. 3/
marketcharts.com/page/5555e817
Read 16 tweets

Did Thread Reader help you today?

Support us! We are indie developers!


This site is made by just two indie developers on a laptop doing marketing, support and development! Read more about the story.

Become a Premium Member ($3/month or $30/year) and get exclusive features!

Become Premium

Don't want to be a Premium member but still want to support us?

Make a small donation by buying us coffee ($5) or help with server cost ($10)

Donate via Paypal

Or Donate anonymously using crypto!

Ethereum

0xfe58350B80634f60Fa6Dc149a72b4DFbc17D341E copy

Bitcoin

3ATGMxNzCUFzxpMCHL5sWSt4DVtS8UqXpi copy

Thank you for your support!

Follow Us!

:(