Reprocessing old data as I get ready for some clear skies later this week! This is the Tadpole Nebula, projected in HSO colour scheme. 100 light years across with and 12,000 light years away from us.
The Spider (IC 417) and Fly Nebula (NGC 1931), two stellar nurseries with young, open star clusters. Of course, the Tadpole Nebula, too, is full of young stars being created!
For a larger view...
/2
This is the full scene! For scale, the small "fly nebula" on the right is 10 light years across.
BC Deaths per week and Cumulative excess mortality (starting in 2020), showing the consequences of the pandemic (and the startling consequence of the mismanaged heat dome event of 2021) on our populace.
to calculate excess mortality due to drug overdoses there are two ways to do it: one is using monthly mortality to create an ARIMA projection based on the previous 5 years (the "5y" in my graph), the other is to simply compare to 2019's numbers ("2019")
In excess of expected deaths, 10,680 ADDITIONAL British Columbians died since the pandemic started. Of those, ~625 are due to the heat dome event, 2430-3422 are due to the contaminated drug supply, and 6000+ are left in the balance, likely the COVID-19 pandemic itself.
"Deaths of Despair" (a health economics concept used to link alcohol, drug, and suicide deaths) is a Nobel-winning ECONOMICS concept, but it is not a good MORTALITY concept.
Alcohol, drug, and suicide deaths have very different inputs and issues.
/1
The pandemic and kids probably is the best example as to why this is. Suicide deaths (graphed), alcohol-related deaths (2019: 39; 2020: 27) in young people DID NOT increase during the pandemic.
/2
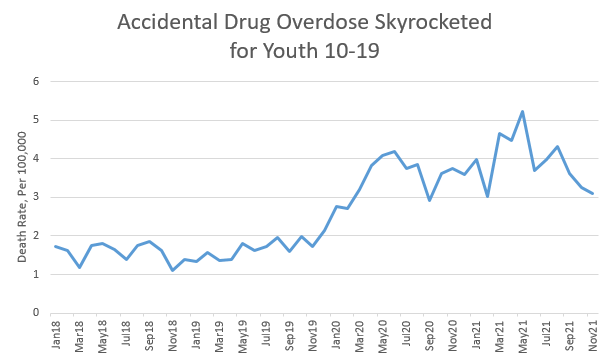
Drug overdoses, on the other hand, increased sharply, due to a tainted drug supply (no shipping, importing, smuggling, resulting in contaminated drugs, potent drugs, and synthetic drugs) that is now very difficult to resolve. Fentanyl/synthetic opioids are easy & cheap.
Quite literally, many many people and organizations were specifically saying that returning to schools was necessary to protect and improve their mental health.
Its hard sometimes to be on twitter and not feel phenomenally gaslit. How someone could claim this is beyond words.
I literally wrote this op-ed in AUGUST OF 2020 because of the fearmongering, evidence free assertions that kids needed to be in school "to restore their mental health" thestar.com/opinion/contri…
my position WAS and ALWAYS WILL BE: "School is great! but it's stressful. lets really work on school bieng LESS stressful if we are going to purport to care about things like kids dying of suicide or having ER presentations for mental health crises"
I posted this yesterday. In it, we clearly see that school months are associated with pediatric suicide, 2016-2019.
So, quick question... What would you expect to see in 2020, when schools were CLOSED March to June?
/1
And here it is, plain as day. When the "shutdown" occurred, children's suicides flattened out to summer rates, and held all the way through to when schools across the nation started opening up again.
/2
This graph is the "clincher".
In it, I compare the rate of Mar-Jun to the school year's previous months, and we can clearly see that 2020 is a significant outlier year.
The pediatric suicide rate drop after "shutdown" was unprecedented.
People are asking about the stats I presented about school days being associated with child suicide. There are many ways to look at it.
Simply, using July as a reference month, you can easily see "school peaks."
It's very striking.
/1
This is COMPLETELY UNLIKE what the graph looks like for adults (18-64), where we see small changes but undeniably summer adult suicide rates are higher than winter months.
Pediatric suicide is unique in its school month distribution.
/2
We can do the same thing with days, using Sunday as reference. We drop the partial/nonschool months so we compare the days of the week for January-May & September to November.
Again, it is a striking effect. Weekdays are strongly associated with increased pediatric suicide.