9 trading strategies everyone should know (with Python code):
Bollinger Bands Pattern Recognition
The mid band is the moving average on the price series.
The upper and lower bands are two moving standard deviations away from the mid band.
The mid band is the moving average on the price series.
The upper and lower bands are two moving standard deviations away from the mid band.

MACD oscillator
MACD refers to Moving Average Convergence/Divergence.
MACD is a momentum trading strategy.
It assumes momentum has more impact on short-term moving average than long-term moving average.
MACD refers to Moving Average Convergence/Divergence.
MACD is a momentum trading strategy.
It assumes momentum has more impact on short-term moving average than long-term moving average.

Pairs Trading
Pairs trading is a basic form of statistical arbitrage.
It assumes that two cointegrated stocks do not drift too far away from each other.
When they do, it generates the trading signal.
Pairs trading is a basic form of statistical arbitrage.
It assumes that two cointegrated stocks do not drift too far away from each other.
When they do, it generates the trading signal.

Heikin-Ashi Candlestick
Heikin-Ashi refers to 'Average Bar' in Japanese.
It's an alternative style of candlestick chart.
The rules of Heiki-Ashi are designed to filter out the noise for momentum trading.
Heikin-Ashi refers to 'Average Bar' in Japanese.
It's an alternative style of candlestick chart.
The rules of Heiki-Ashi are designed to filter out the noise for momentum trading.

London Breakout
It’s an information arbitrage strategy across different markets in different time zones.
As FX markets are decentralized, you can take a peek at the activity in a closed foreign FX market before the opening of the domestic FX market.
It’s an information arbitrage strategy across different markets in different time zones.
As FX markets are decentralized, you can take a peek at the activity in a closed foreign FX market before the opening of the domestic FX market.

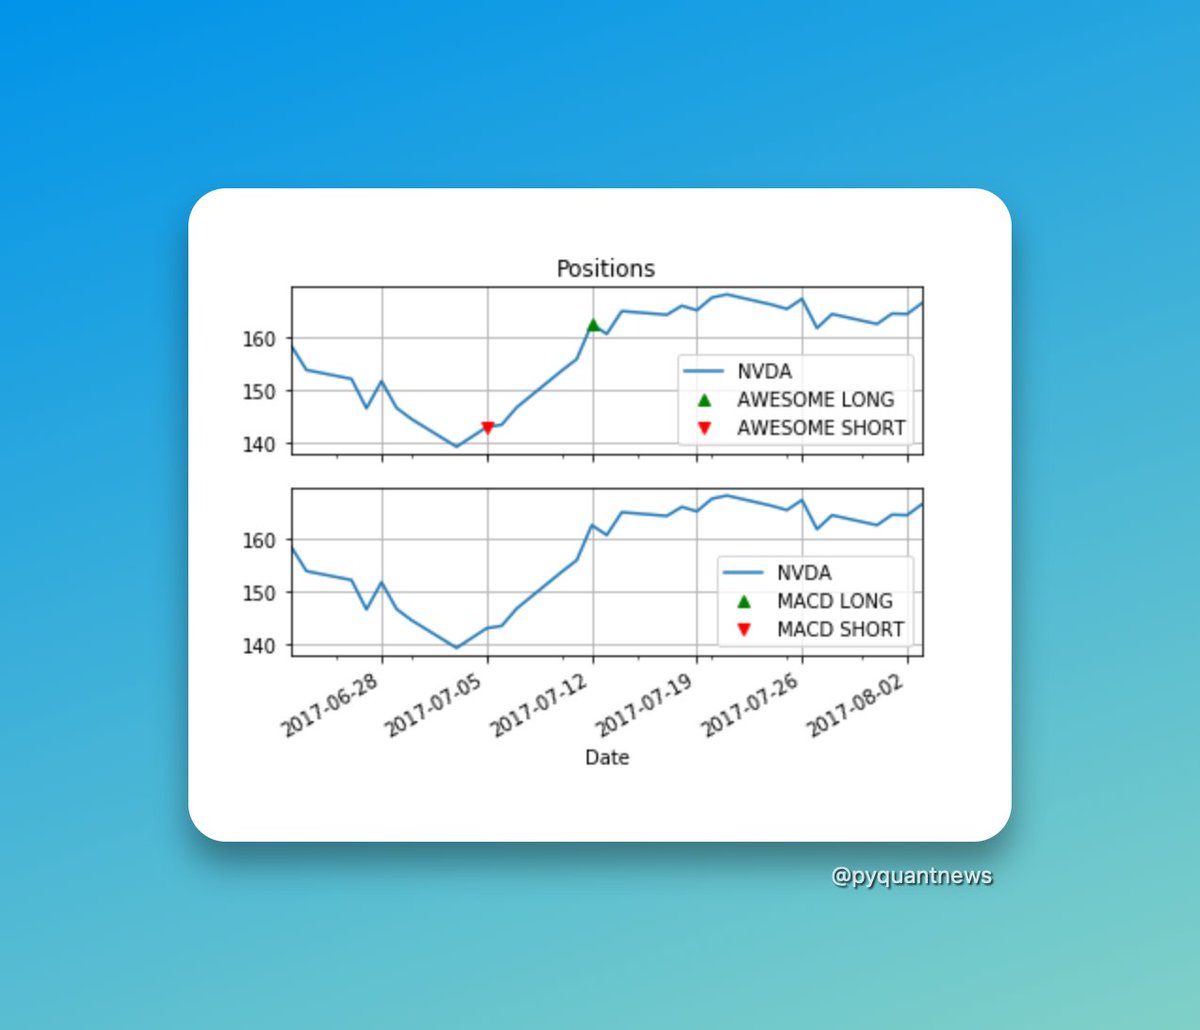
Awesome Oscillator
Awesome oscillator is an upgraded version of the MACD oscillator.
Instead of taking a moving average on the close price, it uses the mean of high and low.
It uses short-term and long-term moving averages to construct the oscillator.
Awesome oscillator is an upgraded version of the MACD oscillator.
Instead of taking a moving average on the close price, it uses the mean of high and low.
It uses short-term and long-term moving averages to construct the oscillator.
Dual Thrust
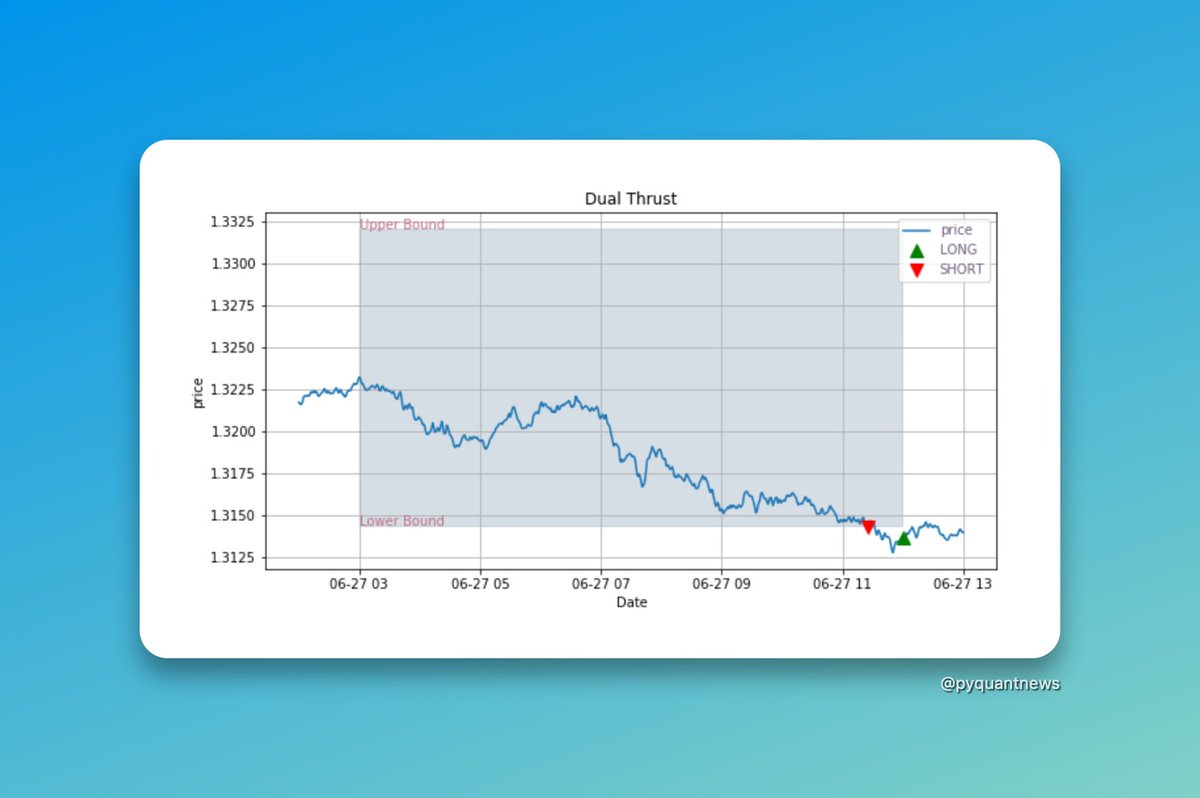
Dual thrust is an opening range breakout strategy.
We establish upper and lower thresholds based on previous day's open, close, high and low.
When the market opens and the price exceeds the thresholds, take positions before the thresholds.
Dual thrust is an opening range breakout strategy.
We establish upper and lower thresholds based on previous day's open, close, high and low.
When the market opens and the price exceeds the thresholds, take positions before the thresholds.
Parabolic SAR
Parabolic SAR identifies the stop and reversal of a trend.
It's used to identify resistance to the price momentum.
Orders are executed when the SAR and price curves cross over.
Parabolic SAR identifies the stop and reversal of a trend.
It's used to identify resistance to the price momentum.
Orders are executed when the SAR and price curves cross over.

Relative Strength Index Pattern Recognition
RSI reflects the current strength/weakness of the stock price momentum.
When RSI above 70 is overbought and RSI below 30 is oversold.
RSI reflects the current strength/weakness of the stock price momentum.
When RSI above 70 is overbought and RSI below 30 is oversold.

And if that isn't enough, there's 8 more strategies here:
github.com/je-suis-tm/qua…
And if THAT isn't enough, there's one more thing for you:
github.com/je-suis-tm/qua…
And if THAT isn't enough, there's one more thing for you:
Check out the 46-Page Ultimate Guide to Pricing Options and Implied Volatility With Python.
Here's why:
• Compute Black-Scholes, the greeks and implied volatility
• Includes a Jupyter Notebook with the code
• How to use Python to analyze the results
pyquantnews.gumroad.com/l/46-page-ulti…
Here's why:
• Compute Black-Scholes, the greeks and implied volatility
• Includes a Jupyter Notebook with the code
• How to use Python to analyze the results
pyquantnews.gumroad.com/l/46-page-ulti…
That's a wrap!
If you enjoyed this thread:
1. Follow me @pyquantnews for more of these
2. RT the tweet below to share this thread with your audience
If you enjoyed this thread:
1. Follow me @pyquantnews for more of these
2. RT the tweet below to share this thread with your audience
https://twitter.com/pyquantnews/status/1553355760754692098
• • •
Missing some Tweet in this thread? You can try to
force a refresh