John Kennedy Profile picture
Aug 3, 2022 18 tweets 3 min read Read on X
When an article says "some scientists think" then remember this: I, a scientist, once thought I could fit a whole orange in my mouth. I could, it turns out, get it in there, but I hadn't given sufficient thought to the reverse operation.
I should also, on reflection, have practiced in private. I had an audience, which grew as my initial satisfaction at an hypothesis well proven, slipped rapidly through stages of qualm, disquiet, then alarm (mild through severe) and ended in full blown panic.
When one panics, one's muscles tense, which is of course, the opposite of what I needed here. I had been quite relaxed at the start, but now I couldn't get a finger between the orange and the very taut edges of my mouth.
Above and below, the orange, which was now under some pressure, deformed to make a nearly perfect seal against my teeth. I hadn't previously been aware of how much oxygen one needs to consume an orange, but I was made aware of it now by its sudden and ongoing lack.
I forgot for a moment that I had nostrils and tried to breathe in hard through my mouth. I have big lungs. When the doctor tested my lung capacity, I blew the end clean off the cardboard tube.
I've always been vaguely proud of that; mostly for want of more tangible achievements and because I am, when all is said and done, the kind of person otherwise predisposed to shove a whole orange in his mouth without cause.
Those enormous lungs - my pride and joy - expanding in this moment of crisis to their fullest extent, had created a hard vacuum behind the orange, which, at that point imploded.
From now on, things which had been unfolding at an almost leisurely pace, started to happen rather fast. So, I will take this opportunity to say that no one had actually tried to help me up till now. This was not for lack of opportunity.
Later, someone mentioned the kind of details - veins like worms scribbling incomprehensible messages across my forehead, eyes popping out as if on stalks, laced with tiny red veins - which one can only truly apprehend at a distance that wouldn't have made help impossible.
But back to the imploding orange. Although it didn't diminish appreciably in volume upon implosion, the released juice vaporised, turning into a burning acidic cloud that instantly flooded my lungs.
My lungs very sensibly responded by collapsing rapidly aided by an involuntary and powerful spasm from my diaphragm.
The vapour and oily zest from the orange's skin mixed with mucus scoured from my lungs (that spread flat, we must remember, would cover a tennis court) as well as the last of my residual oxygen, exited now through my rediscovered nostrils as a magnificently abundant yellow foam.
And, having a volume in excess of what could easily egress at speed via those narrow tubes, it also squirted out through nearby exits, including around my eyes.
Even that wasn't enough and the build up of pressure finally proved too much for the orange, which left my mouth like grapeshot from a cannon, like the superluminal jets generated by matter falling towards a black hole at relativistic speed.
Temporarily blind and gasping in my own private world of consequences, I was unaware of the cone of devastation that I had unleashed upon the unluckier segment of my audience, occupying roughly one steradian of solid angle to my front.
When I finally recovered my senses and the cycle of whooping inhalation and coughing fits had exhausted itself, I was greeted not by the concern that I felt such a brush with death merited, but with a disgust that later reflection suggests may not have been wholly unwarranted.
So, anyway, whenever you read "some scientists think", think about me and recalibrate the lower end of your expectations accordingly.
An unrolled version of the thread can be found here: diagrammonkey.wordpress.com/2022/08/06/som…

• • •

Missing some Tweet in this thread? You can try to force a refresh
 

Keep Current with John Kennedy

John Kennedy Profile picture

Stay in touch and get notified when new unrolls are available from this author!

Read all threads

This Thread may be Removed Anytime!

PDF

Twitter may remove this content at anytime! Save it as PDF for later use!

Try unrolling a thread yourself!

how to unroll video
  1. Follow @ThreadReaderApp to mention us!

  2. From a Twitter thread mention us with a keyword "unroll"
@threadreaderapp unroll

Practice here first or read more on our help page!

More from @micefearboggis

Dec 1, 2023
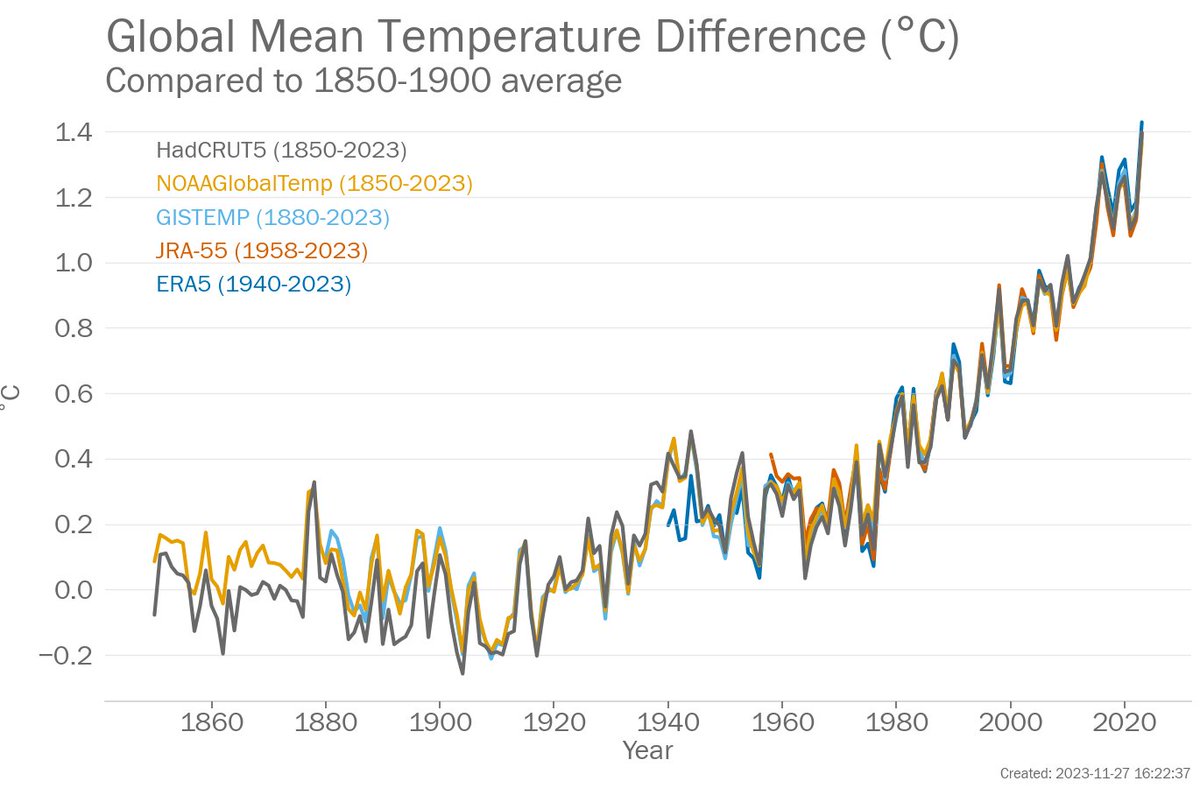
So, the WMO’s provisional State of the Global Climate 2023 report is out. Long-term the story hasn’t changed: world warming, sea rising, ice melting, as well as everything that goes with that. There are details of course, so thread… 1/n Graph of global annual temperature anomalies (difference from the 1850-1900 average) from 1850 to 2023. Five datasets are shown: HadCRUT5, NOAAGlobalTemp, GISTEMP, JRA-55 and ERA5.
You can read the report here:
And the press release:
2/nwmo.int/resources/publ…
wmo.int/news/media-cen…
Global concentrations of the three key greenhouse gases – CO₂, CH₄, N₂O - reached record highs in 2022. The annual growth rates of CH₄ and N₂O were particularly high. 3/n six graphs showing (reading top left to bottom right) greenhouse gas concentrations for carbon dioxide, methane and nitrous oxide, then annual growth rates for carbon dioxide, methane and nitrous oxide.
Read 30 tweets
Mar 10, 2020
Thread. WMO statement on the State of the Global Climate in 2019 in partnership with UN agencies and many others. Some key points... library.wmo.int/index.php?lvl=…
1. Carbon dioxide, methane and nitrous oxide - the three main greenhouse gases - reached record levels in 2018, according to data from the World Data Centre for Greenhouse Gases. Individual site series suggest they increased further in 2019. gaw.kishou.go.jp Carbon dioxide concentration (parts per million) in the atmosphere from three data sets: Mauna Loa, NOAA and the World Data Center for Greenhouse Gases. All three show a clear upward trend that is much larger than the annual cycle and year to year changes.
2. Over the 2009–2018 decade global fossil CO₂ emissions were on average 34.7±1.8 GtCO₂ per year, growing at an average rate of 0.9% per year to reach a record 36.6 GtCO₂ in 2018 @gcarbonproject
earth-syst-sci-data.net/11/1783/2019/
Read 26 tweets
Oct 18, 2019
Confused by different baselines for global mean temperature? Print out this handy graph and put it in your small money bag. Now with bonus baselines. Global mean temperature graph showing temperature differences between commonly-used temperature baselines: 1850-1900, 1880-1900, 1961-1990, 1981-2010, 1986-2005, 1995-2014 and 2010-2019.
1850-1900: stand in for "pre-industrial", used by the IPCC SR 1.5 and WMO annual statements.
1880-1900: "pre-industrial" for those whose datasets start in 1880.
1961-1990: WMO recommended normal for climate change assessment
1981-2010: WMO recommended normal for everything else
1986-2005: used for IPCC AR5 model projections, 20 years up to the last year of the historical simulations.
1995-2014: ditto for AR6
2010-2019: past decade, also the warmest decade on record.
Read 4 tweets

Did Thread Reader help you today?

Support us! We are indie developers!


This site is made by just two indie developers on a laptop doing marketing, support and development! Read more about the story.

Become a Premium Member ($3/month or $30/year) and get exclusive features!

Become Premium

Don't want to be a Premium member but still want to support us?

Make a small donation by buying us coffee ($5) or help with server cost ($10)

Donate via Paypal

Or Donate anonymously using crypto!

Ethereum

0xfe58350B80634f60Fa6Dc149a72b4DFbc17D341E copy

Bitcoin

3ATGMxNzCUFzxpMCHL5sWSt4DVtS8UqXpi copy

Thank you for your support!

Follow Us!

:(