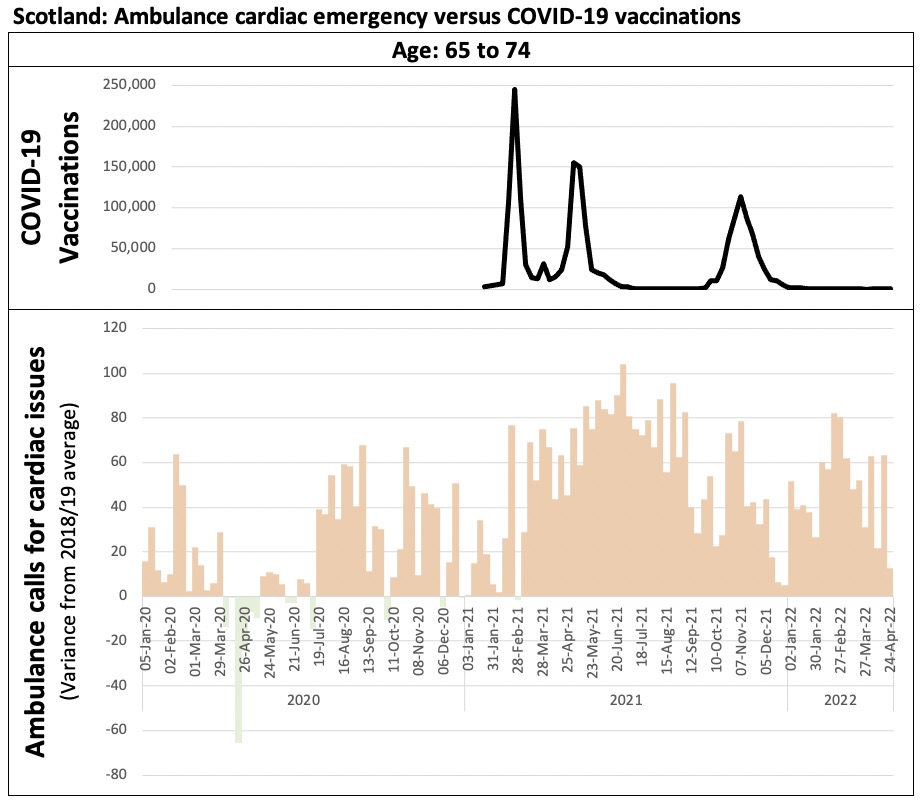
We've now had equal periods without vaccines (Mar20 until rollout complete in May21) and without vaccines (May21 until now), 63 weeks of each.
We see that despite assurances, ‘acute COVID hospitalisations’ post #sacredcows are 59% higher in the 60+, and 133% higher in under 60s
What we see is;
- More people hospitalised, both <60 (19,000 versus 8,000) and in the'vulnerable' 60 and above (27,000 versus 17,000)
- NO more 'flat' periods where there are no admissions, the rate of admissions is faster than before, and incessant, no breaks
So too ICU - PHS now note "If people test COVID-19 positive on admission to hospital, it may not be the primary reason for admission, and instead an incidental finding"
No 💩 Sherlock, been saying that forever. Look at winter 2020 - 50% of ICU was “Non-COVID19 clinical diagnosis"
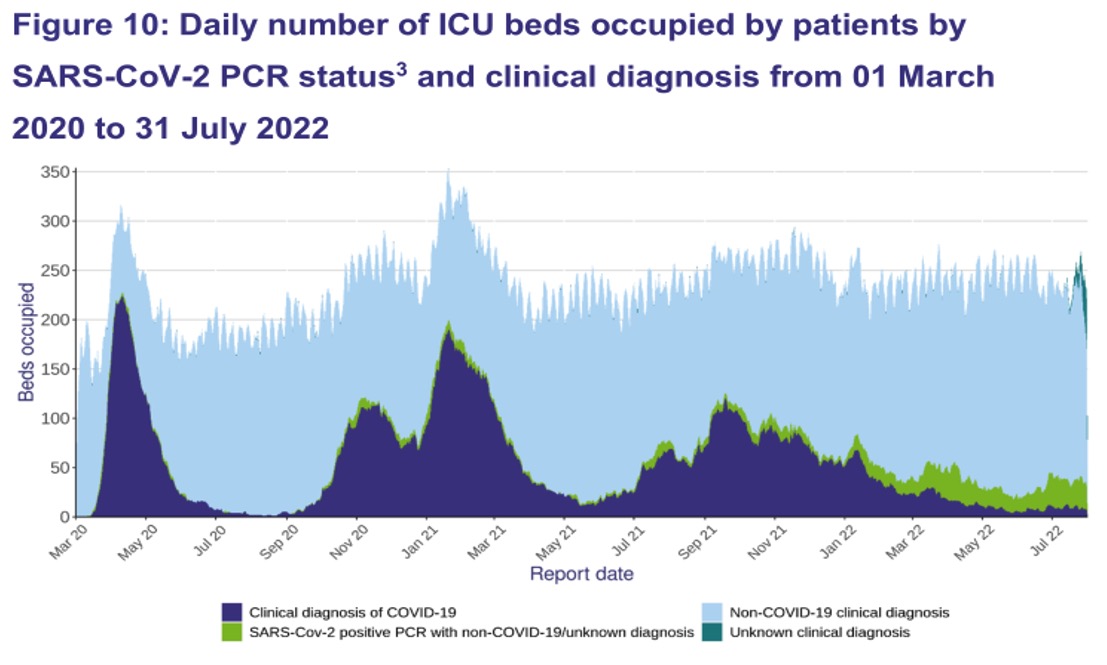
Note the data in the chart above run RIGHT BACK TO THE START.
That means when government was shutting down your business in winter 2020, they KNEW - they had the data - that half of those numbers were incidental, non-COVID.
And they crushed your business anyway.
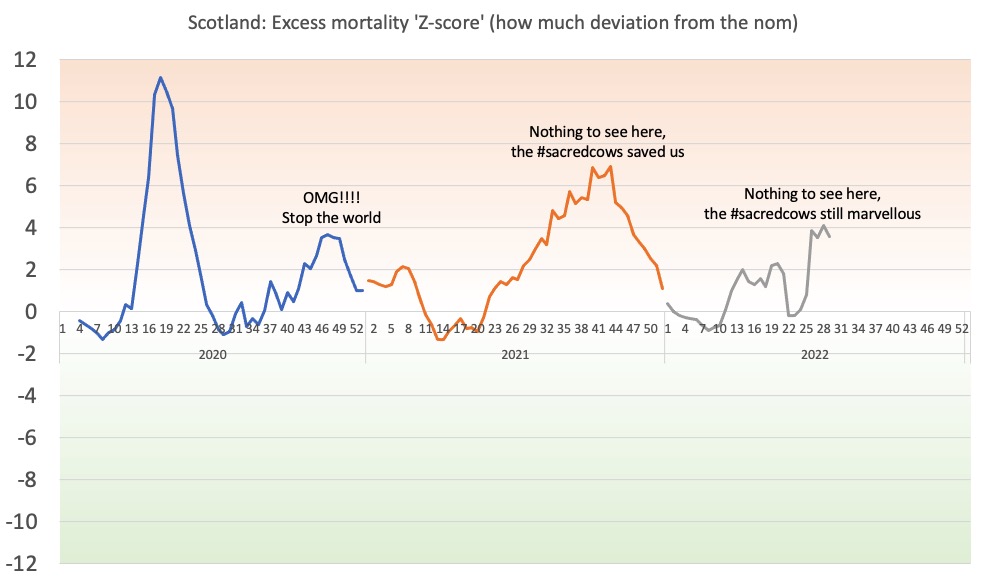
(Also frustrating that PHS seem happy with public health in Scotland - apparently oblivious to the fact that excess mortality is as bad as winter 2020 (+4 standard deviations of Z-Score), and last autumn was even worse).
If it ain’t COVID, it don’t matter?
• • •
Missing some Tweet in this thread? You can try to
force a refresh
Scotland hospital status updated. 1. Do you need an op?
Upper endoscopy waitlist slightly down, but all other endoscopy waiting lists sharply up, and all imaging waitlists (e.g. CT, MRI) hugely up - ultrasound waitlist nearly doubled.
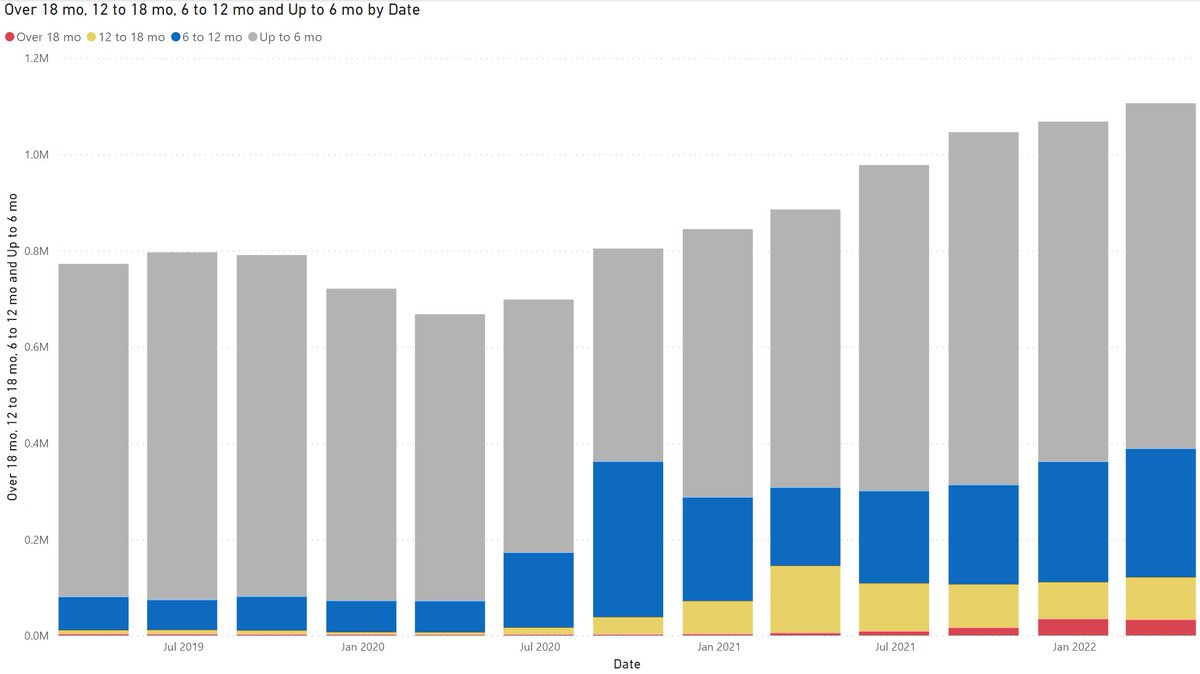
2. You need an op - how is the waitlist?
Chart shows number on the waiting list, and how long they have been waiting. Total continually rising, as well as the proportion waiting 6 months, 12 months, or longer.
3. How are we tackling that list?
This shows the number of operations carried out, in total and by month.
The number has been basically steady since early 2021, not recovering toward prior levels. Running around 33% lower than the pre-COVID levels.
Scotland: 2022 mortality, Week 23 (NRS) scottishunity.org/scotland-morta…
Week 22 was low due to the holiday weekend, this week is therefore a rebound high. Averaging weeks 21, 22, 23 show Scotland right on the 5 year average across those weeks
That said, this has been / is the highest period of excess mortality Scotland has ever seen at this time of year, other than the lockdown induced mayhem of 2020.
Looking too at summer 2021, why such anomalous periods of extreme high mortality?
Cumulatively this period of excess is currently running at the same level as we saw suddenly appear last summer. The same excess as spring 2020 - in spite of all the ‘protection'
Scotland: 2022 mortality, Week 19 (NRS) scottishunity.org/scotland-morta…
Last year mortality would look like easing, then next week spike up, continual excess. This year same. Week 19 is +18%, far above what would be expected.
Some details are striking (see below)
This overlays 2022 excess with the unprecedented summer 2021 spike. The trend is worse at this point, +1,066 deaths from 5 year average, and higher than at the same point in 2021.
Worrying, this needs to settle, and be investigated.
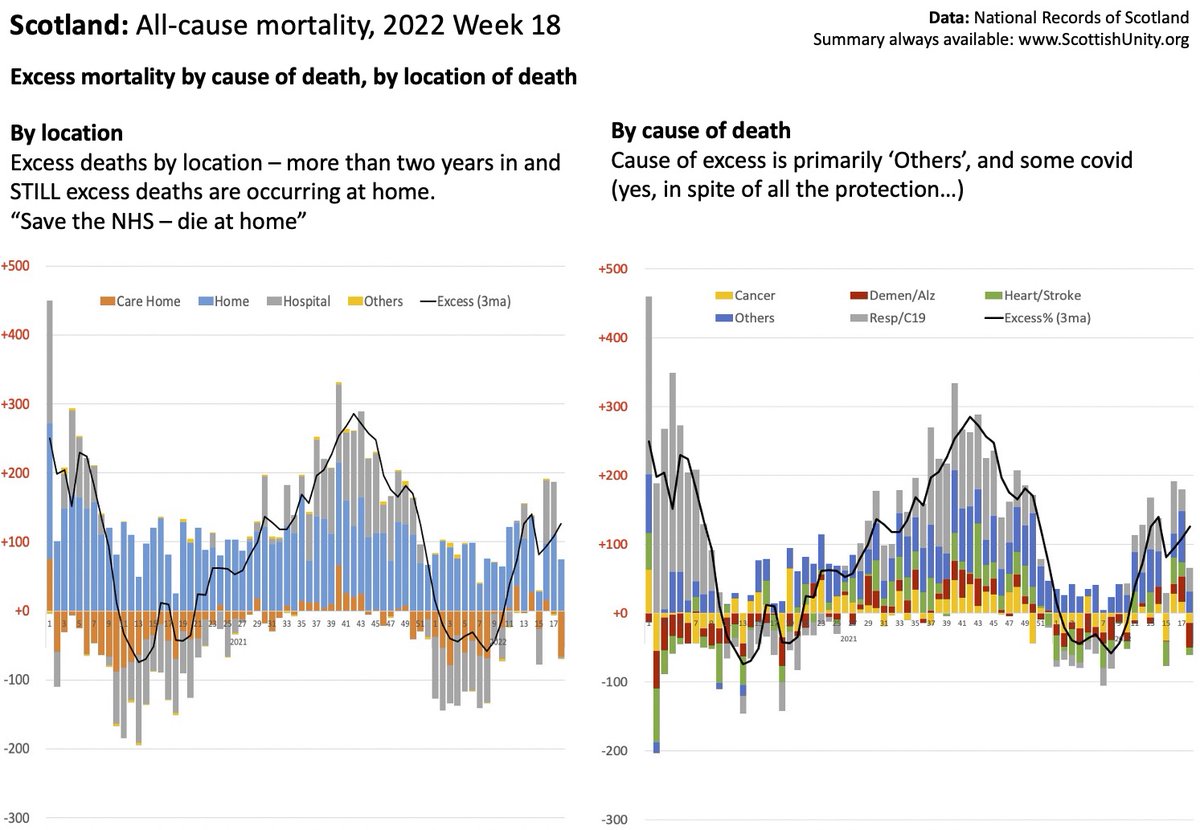
Excess by cause and by location.
It’s ‘deaths at home’, and the cause is ‘Others’.
For a year and a half…..
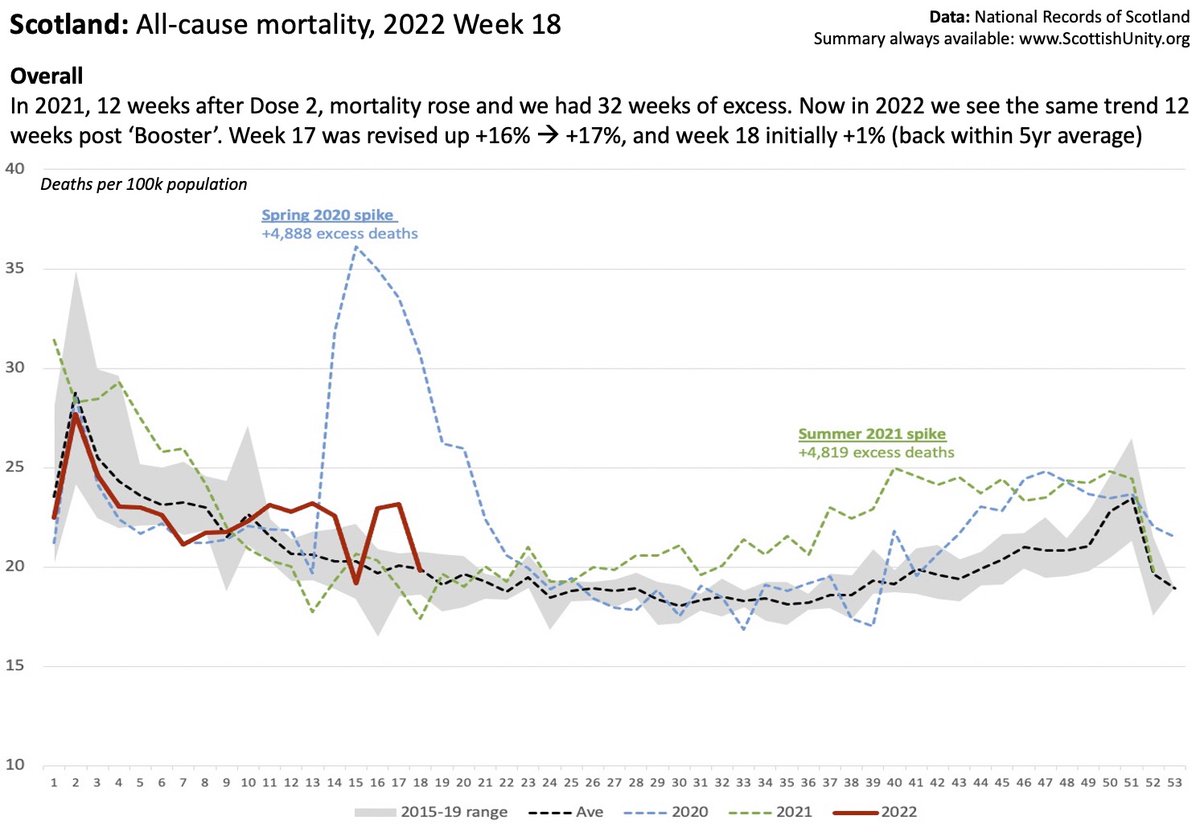
Scotland: 2022 mortality, Week 18 (NRS) scottishunity.org/scotland-morta…
Recent elevated mortality dips back into the normal range. Still well in excess overall, and looking worryingly similar to last summer trend (see next tweet).
Hopefully should settle
This shows the cumulative trend, this spike relative to last summer’s. You can see tracking very similar, but actually slightly more severe over the same period of time.
Mmm, quite a few thoughts
If we look year-to-date in comparison to prior years, we can see (a) the only significant variant is male infants, and (b) even that is at numbers we have seen in the past - it's not uncharted ground.
Then if we see the mortality trend of age 1-14 (excluding <1 y.o.), females look rather low, and males are high end of normal, behind 2015 and 2016
When we separate only the infants (<1), again females are very low. Males are high, but still below what was experienced in 2015, 2016.
Unusual trend though - starts very low then suddenly turns and races up.
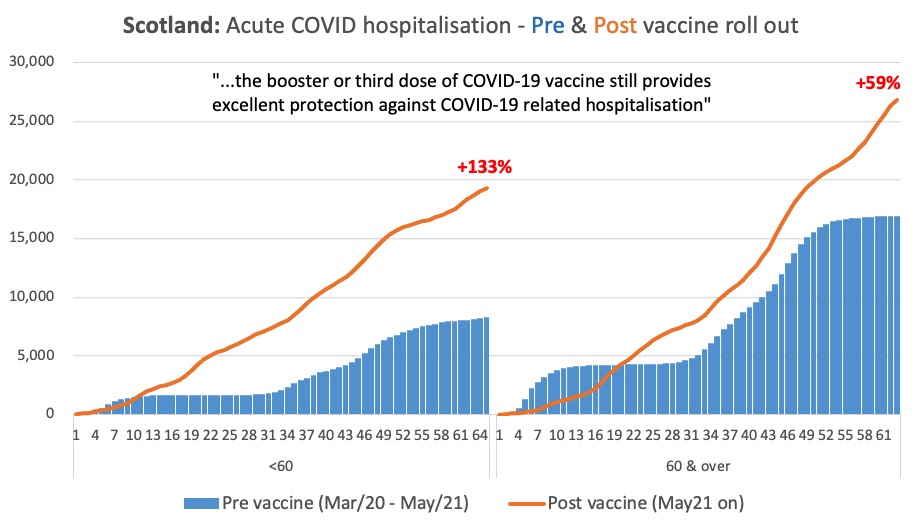
PHS updated dataset on emergency ambulance cardiac events - this is age group 15 to 44, others below.
Are the media just not going to talk about this? The correlation is so exceptional it's hard work NOT to see it.
What do experts like @DrAseemMalhotra & @FatEmperor make of it?