Let's talk European electricity, shall we?
Thread
Part I (of many more to come); 1/n
Thread
Part I (of many more to come); 1/n
European electricity prices are spiking for all major economies except for Spain. But also Spanish consumers pay 3x more compared with only May 2021.
2/n
2/n

In fact, most European power prices are 12-15x higher than they were in 2015. Needless to say, the European industry will go into a deep recession at these prices.
3/n
3/n

All commodities price at the margin. So do electricity prices. As the EU grid enters an unprecedented phase of change, away from dispatchable baseload power such as nuclear or coal fired power towards Renewable Energy Sources, more price volatility is the only certainty.
4/n
4/n

But why are prices high now? Because the EU grid needs a lot of gas. In 2021, 17.3% of Europe’s 3,100 terawatt-hours (for comp: US 3,900TWh) of power production came from gas-fired plants. Gas derived power production is the 2nd biggest energy contributor to the EU grid.
5/n
5/n

In other words, EU gas prices set the marginal price for electricity. Therefore, higher EU gas prices also drag up electricity prices.
6/n
6/n

Meanwhile (and as most of you know), EU gas is in short supply as Russia cut gas by some 41% YTD when compared with 2021 (more vs 2019). Worse, since July Russia, cut Nord Stream 1 supplies to 30mcm/d (vs. 160mcm/d capacity). That caused gas prices to spike.
7/n
7/n

European gas prices don't like it when the largest supplier Gazprom (200bcm of a 500bcm market pa in 2019) does not deliver. Hence, prices have NEVER been higher in recorded history at this time of the season, that is higher by a factor of 10 times!
8/n
8/n

You guessed it: coal-fired production will have to replace gas. Subject to coal’s import availability, coal may set the price of electricity as the new marginally dispatched (demanded) atom of the grid. Yes, coal is well & alive. Hydrocarbons = modern life!
9/n
9/n

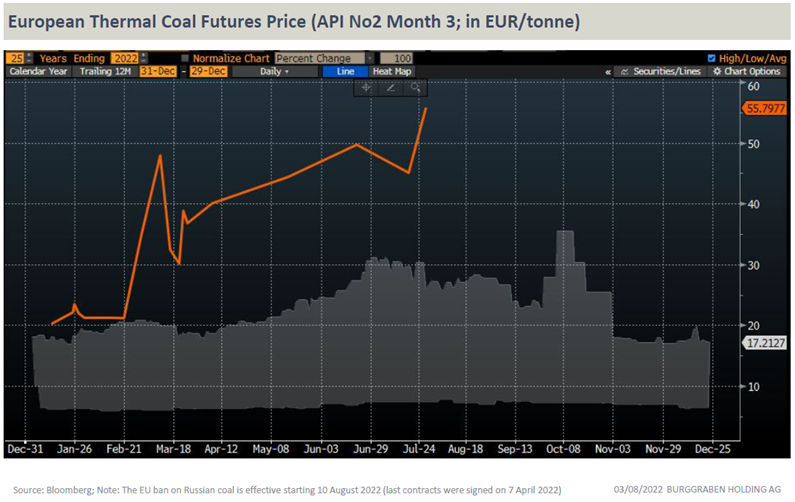
Meanwhile, EU coal prices are more expensive than at any time in recorded history too (25y) as Europe scrambles to replace 58 million tonnes pa of thermal coal it mustn’t source from Russia while coal production came rather unfashionable for the past decade (green shift).
10/n
10/n
As is nuclear electricity production. And so slow & steady brain drain from this industry has remifications too. Take France. It's nukes produce 30-40% below its 10-year averages. Given it's overall importance for the EU grid, that is rather concerning...
11/n
11/n

…and which is the main reason why French peak load power prices for December 2022 are at €2037/MWh - another all time record!
You see, this entire green shift has consequences which 99% of consumers NOT YET understand. But they will, sooner or later.
12/n
You see, this entire green shift has consequences which 99% of consumers NOT YET understand. But they will, sooner or later.
12/n

Can EDF, the French operator, fix the maintenance issues? I think so. The thing is: the French state company has a habit of over-promising and under-delivering. Time will tell.
Allez les bleues!
13/n
Allez les bleues!
13/n

Fact is, between 2014-2016, France - 2nd largest grid in EU by a wide margin - didn’t import power on a single day.
Last year however, it bought electricity from overseas for 78 days. So far this year, it has been forced to do so on a record 102 days.
14/n
Last year however, it bought electricity from overseas for 78 days. So far this year, it has been forced to do so on a record 102 days.
14/n

Which brings us to the German grid, Europe's largest.
Can they help France? Unlikely. In fact, they may need help too if the Gov want to save gas in power AND shut-down its nukes by y-end (currently re-considered). Or can German coal save us from the risks in the winter?
15/n
Can they help France? Unlikely. In fact, they may need help too if the Gov want to save gas in power AND shut-down its nukes by y-end (currently re-considered). Or can German coal save us from the risks in the winter?
15/n

Some basics first. GER coal power production has huge advantages. It provides dispatchable load while 100% of lignite is mined in G. That makes it the cheapest, most reliable electricity other than nuclear.
16/n
16/n

The Gov knows that. In July, minister Habeck issued an ordinance to return up to 16 coal- & oil-fired power plants to come out of the “grid reserve”. In addition, 8 hard coal & lignite power plant licenses are prolonged beyond Oct 2022 to help save natural gas. But can it?
17/n
17/n

However, so far in 2022 gas-fired power production continues unabated. Why?
18/n
18/n

Because switching from gas to coal on industrial scale cannot be easy. Some voices goes as far and say “only one of Germany’s 16 coal fired power plants will restart operations, and only this autumn.” I'm less sure but here are some of the challenges...
19/n
19/n

We took a closer look. First, most of German hard coal production (again, lignite is not imported), power or industrial use, has directly or indirectly access to German’s inland river system which transports most of its annual thermal coal imports of some 44 million tonnes.
20/n
20/n

The Rhine river alone transports some 75% of Germany’s hard coal imports due to its significant transportation cost advantages.
21/n
21/n

A modern Rhine coal barge carries 7kt of coal. At that load, it has a draught of >3 meters. We assume an avg power plant (100 – 1100 MW) requires 400 tonnes of feedstock per MWh of production. This would imply, say, EnBW requires 1-4 barges (class VIb) each day. Can it?
22/n
22/n


Well, that comes down to weather. The ongoing heat wave has impacted Rhine water levels. Within 6 weeks, large parts of the Rhine river are well below the required 1.5 meter gauge level for a barge to transport at full capacity.
23/n
23/n

According to our calculations, as at 3/8/22, large parts of the middle & upper Rhine river only allow for limited coal loadings (1/3 or less beyond Kaub). Such conditions, while not infrequent, will draw emergency stocks at coal plants.
24/n
24/n

Kaub is the “bottleneck” gauge station of the Rhine river in Germany. It reached a new seasonal all time low (antoher one!) and is now well below the required 1.5 meters (150cm) for full loadings.
25/n
25/n

And its forecast? A shocker!
Kaub's 14-day forecast is for water levels to approach unsafe levels for transportation. Yes, we like to go the extra mile for you :-)...
26/n
Kaub's 14-day forecast is for water levels to approach unsafe levels for transportation. Yes, we like to go the extra mile for you :-)...
26/n

Lower loadings mean higher rates for merchants to break even. At some point, such rates may make purchasing coal uneconomic or simply restrict power production as the required daily feedstock supplies cannot be delivered. Barging may also be stopped due to safety concerns.
27/n
27/n

In short, barging a tonne of coal to a power plant in GER reached €600. Meanwhile, Coal Importers forecast 30mt for 2022 & then some for 2023 while the brokers promise to transport "to it point of nautical-technical impossibility." I believe them.
28/n
28/n

But can they? Our assessment for theoretical annual coal shipping capacities is based on many assumptions but suggests 75 days of low water may reduce shipping capacities to 24 million tonnes pa in 2022. Rail will have to do the rest. Can it? We will see.
29/n
29/n

Meanwhile, other waterways have low water issues too.
Maybe the weather gods want to give green party members one more time to reflect why they want to replace the best nukes in Europe with coal, given EU commitments to reduce CO2 emissions to 0 by 2050?
30/n End - thx!
Maybe the weather gods want to give green party members one more time to reflect why they want to replace the best nukes in Europe with coal, given EU commitments to reduce CO2 emissions to 0 by 2050?
30/n End - thx!

• • •
Missing some Tweet in this thread? You can try to
force a refresh