
Drake London.
To bulletproof, or not to bulletproof? That is the question.
Let's Dive In.
To bulletproof, or not to bulletproof? That is the question.
Let's Dive In.
We will be putting Drake London through the Bulletproof process to see exactly how good... or bad, of a prospect he really is. 
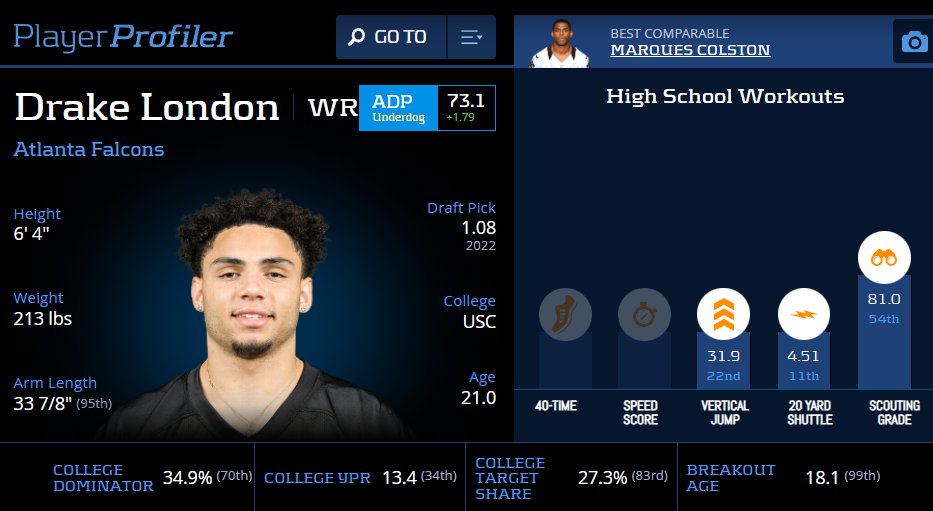
Courtesy of @rotounderworld ultraslick player page we can glean alot about his profile.
First things first. The dude is 6-4 and 213 pounds.
He is a mountain of a man and that qualifies him as a "prototype" in my process.
First things first. The dude is 6-4 and 213 pounds.
He is a mountain of a man and that qualifies him as a "prototype" in my process.
And you might be asking yourself, what in the heck is a prototype and why should I care beancounter!?!
And I am glad you asked.
It is really hard to glean 'upside' through a prospect profile. We see all types of players have success in the NFL to some degree.
And I am glad you asked.
It is really hard to glean 'upside' through a prospect profile. We see all types of players have success in the NFL to some degree.
But what I noticed were that a lot of the truly special fantasy scorers seemed to be... Large.
Based on some seriously excellent work by @CoopsFB we were able to glean that these large players did in fact have higher ceilings than their smaller counterparts historically.
Based on some seriously excellent work by @CoopsFB we were able to glean that these large players did in fact have higher ceilings than their smaller counterparts historically.
I highlight what that looks like exactly within this thread...
PS. I renamed alpha to prototype and dropped the beta tag entirely so that people didnt completely dismiss smaller WRs.
PS. I renamed alpha to prototype and dropped the beta tag entirely so that people didnt completely dismiss smaller WRs.
https://twitter.com/DFBeanCounter/status/1369119686164504577?s=20&t=c4OzoUOHIl04maMtMVHNuA
The beta tag seemed to be forcing fantasy gamers 'off' small WRs in favor of large ones and you should absolutely not take an inferior prototype over an superior non-prototype
I use it as a tie breaker for equal prospects. Not an actual input in making bad players good.
I use it as a tie breaker for equal prospects. Not an actual input in making bad players good.
One of the most impactful articles I had read when developing my process was this dime from @AmItheRealBlair .
rotoviz.com/2019/01/one-we…
rotoviz.com/2019/01/one-we…
I recommend giving it a read and if you dont subscribe to @RotoViz, you need to go precisely to the nearest mirror, look directly into your own eyes, deep within your very soul and ask yourself if you are truly trying to win your leagues or if you are just here for the good times
Wha you will find within that article is that early declares, (IE, college dropouts) are very good at scoring fantasy football points.
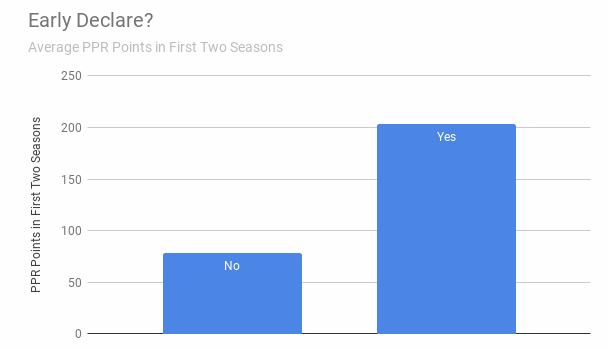
And you can bet your @ss that Drake London dropped the f*ck out.
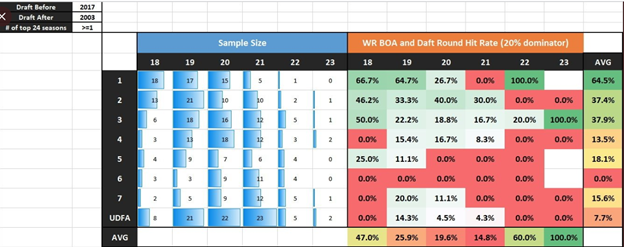
Now this chart right here is an oldie, but a goodie from the great @pahowdy ...
It is plotting draft capital with breakout age and thats it.
If a WR is a first round pick and also an age 18 breakout and we know absolutely nothing else about them, they have a hit rate of 66.7%
It is plotting draft capital with breakout age and thats it.
If a WR is a first round pick and also an age 18 breakout and we know absolutely nothing else about them, they have a hit rate of 66.7%
If you scroll all the way back up to that first image from @rotounderworld you will notice that Drake London sports a phenomenal 18.1 (99th percentile) breakout age.
I would like to at this point remind you that Drake London played at USC... which is whatever. We dont helmet scout in this family.
But we do do (💩) (🤣😂) is appreciate players that step on to the football field from day 1 and force their way onto the field.
But we do do (💩) (🤣😂) is appreciate players that step on to the football field from day 1 and force their way onto the field.
ESPECIALLY when the list of players this player was battling for targets with are none other than Michael Pittman Jr. and Amon-Ra St Brown both of whom have gone on to have strong starts to their NFL careers.
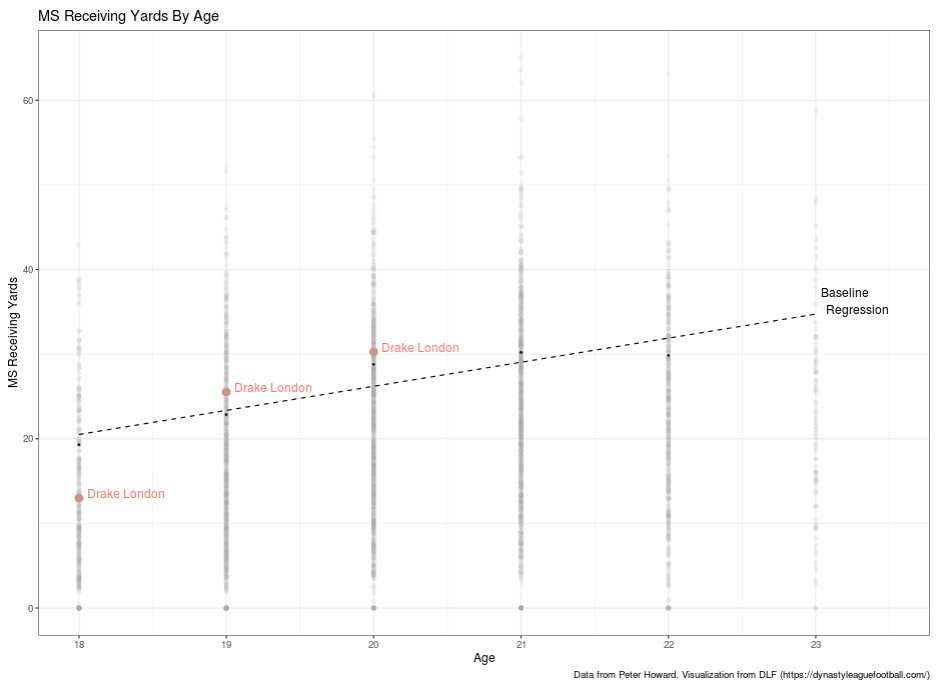
And then we get to good ol' fashion production and one of my favorite metrics is age adjusted market share of receiving yards... (not per game).
You can plot any player you want using this tool @DLFootball and quite frankly you would be a fool not to.
You can plot any player you want using this tool @DLFootball and quite frankly you would be a fool not to.
Now obviously there is a case to be made for using this metric on a per game basis to control for injuries etc and level the playing field.
I do not do this simply because it doesn't work as well in my process, but I do throw out seasons in which a player plays 4 games or less.
I do not do this simply because it doesn't work as well in my process, but I do throw out seasons in which a player plays 4 games or less.
As you were able to see in the prior graph, Drake checks the boxes here without the benefit of game adjusting
But if you were interested in per game metrics I would like you to scroll back up to that chart and now imagine an 18 year Drake playing the 38% of the games he missed
But if you were interested in per game metrics I would like you to scroll back up to that chart and now imagine an 18 year Drake playing the 38% of the games he missed
And then imagine him also playing the 33% of the games he missed as a 20 year old.
The truly remarkable thing about the Drake London profile is that you literally don't have to make up any stories of 'well if he didnt get injured, he would have produced enough'... He just simply produced enough in his final year to hit the mark, DESPITE the injuries.
Another metric I use is yards per team pass attempt, which you can also chart courtesy of the best damn dynasty site on the internet... @DLFootball
I need to note though, that this metric is charted on a per game basis, which is not how I use it within my process.
I need to note though, that this metric is charted on a per game basis, which is not how I use it within my process.
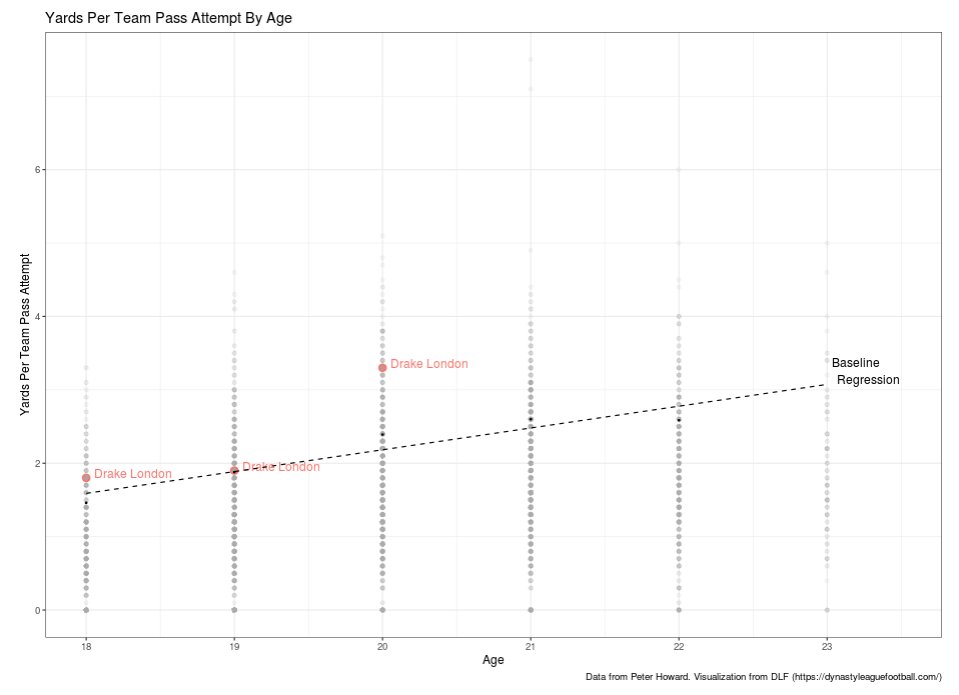
But it goes to show that in the games that Drake London played, he was truly dominant.
But all this per game talk might be raising some red flags for you... but beancounter, is this dude injury prone?!And I have no idea...
But all this per game talk might be raising some red flags for you... but beancounter, is this dude injury prone?!And I have no idea...
So, instead of me pretending to know what I am talking about I tend to just go directly to the professionals.
This is from @DrJesseMorse 's Fantasy Doctors Injury Draft guide...
He grades each player's risk for injury on the scale below.
This is from @DrJesseMorse 's Fantasy Doctors Injury Draft guide...
He grades each player's risk for injury on the scale below.
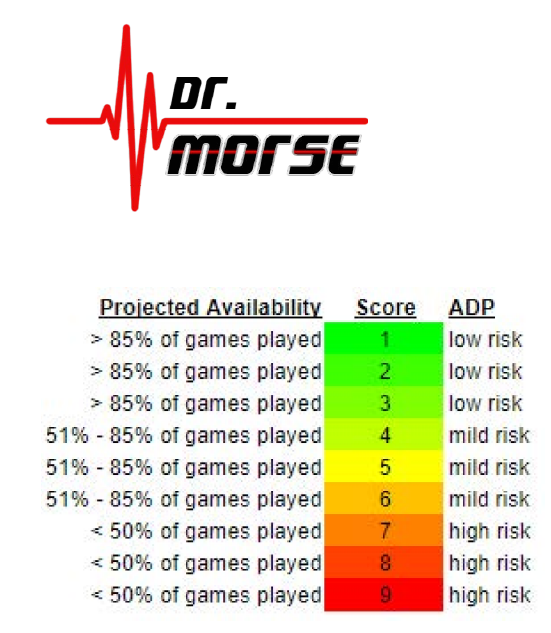
Our boy Drake came in with a 4.5 score which puts him in the "mild risk" category.
That puts him 6th out of the 20 WRs that Jesse graded.
That puts him 6th out of the 20 WRs that Jesse graded.

When it comes to how deeply I care about your fantasy rosters I am obviously going obtain second opinion because we are chasing 'chips here afterall
I was able to pull a couple tweets from the superbly accurate @jmthrivept This one is from right after his ankle dislocation
I was able to pull a couple tweets from the superbly accurate @jmthrivept This one is from right after his ankle dislocation

The thread can be found here.
https://twitter.com/jmthrivept/status/1320092702713679872?s=20&t=9i_BP-N54Od37CiqGcJ7hQ
And this tweet from earlier this month indicating that he is back.
https://twitter.com/jmthrivept/status/1554475231880036357?s=20&t=9i_BP-N54Od37CiqGcJ7hQ
So it seems we have consensus in the medical community that Drake London is not a substantial injury risk and therefore I am moving ahead assuming as such.
And all of this rolls into a singular grade within the process... Bulletproof.
So what does that mean? Well let's slice the data a couple of ways to show you.
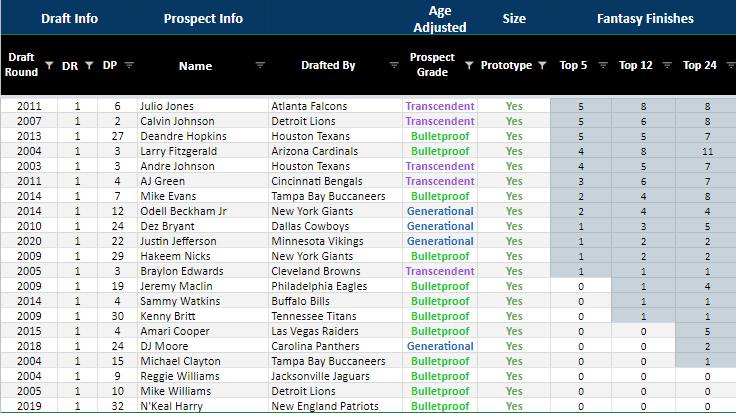
These are all of the bulletproof+ WR's from 2003- 2020.
Top 24 - 31/40 = 77.5%
Top 12 - 25/40 = 62.5%
Top 5 - 13/40 = 32.5%
These are all of the bulletproof+ WR's from 2003- 2020.
Top 24 - 31/40 = 77.5%
Top 12 - 25/40 = 62.5%
Top 5 - 13/40 = 32.5%
But if we want to get specific let's break it down to Bulletproof+ Prototypes drafted in round 1.
Top 24 - 18/21 = 85.7%
Top 12 - 15/21 = 71.4%
Top 5 - 12/21 = 57.1%
Top 24 - 18/21 = 85.7%
Top 12 - 15/21 = 71.4%
Top 5 - 12/21 = 57.1%
Which is like, well yeah of course beancounter.. these are first round picks.. All first round picks are good, what a layup...
And I hear you. We need some frame of reference.
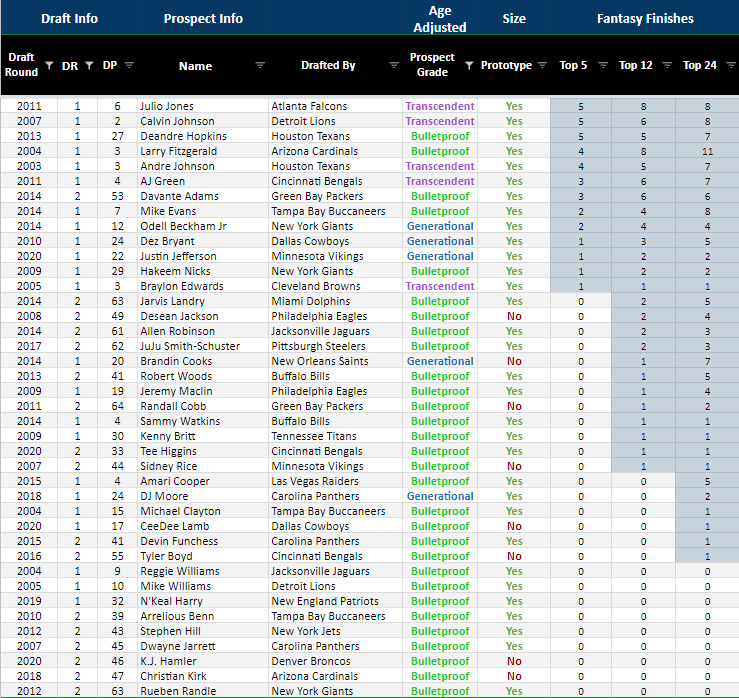
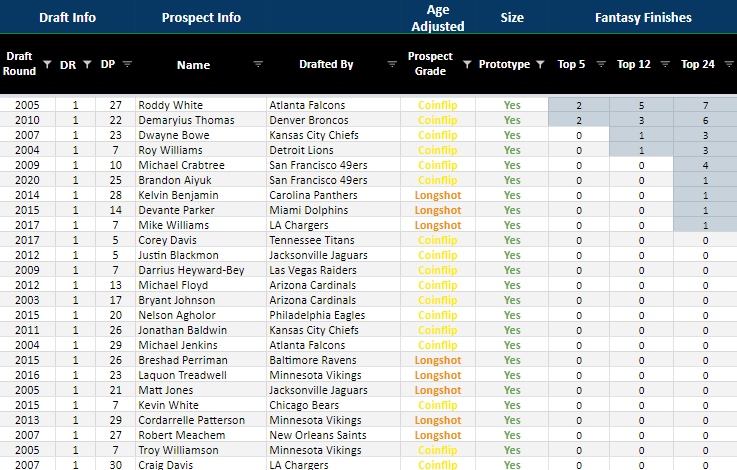
So lets use that same criteria and compare it to players that were NOT bulletproof.
So this is all of the first round prototypes that weren't good enough prospect to qualify based on what was laid out in the thread above.
So lets use that same criteria and compare it to players that were NOT bulletproof.
So this is all of the first round prototypes that weren't good enough prospect to qualify based on what was laid out in the thread above.
Top 24 - 9/25 = 36%
Top 12 - 4/25 = 16%
Top 5 - 2/25 = 8%
Top 12 - 4/25 = 16%
Top 5 - 2/25 = 8%
That is a stark contrast.
But I get it, you are not satisfied. Obviously as fantasy gamers we know MORE than the NFL and not all first round picks are created equal... so what about the first round of dynasty ADP?! Thats the real challenge.
But I get it, you are not satisfied. Obviously as fantasy gamers we know MORE than the NFL and not all first round picks are created equal... so what about the first round of dynasty ADP?! Thats the real challenge.
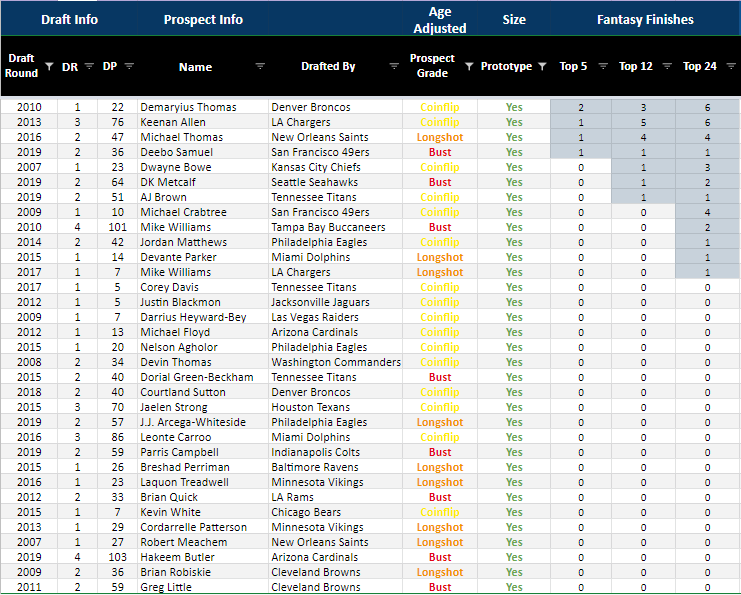
Unfortunately I do not have dynasty ADP pre-2007 so that is as far back as we can go... but here are the non-bulletproof WRs drafted in the first round of dynasty rookie drafts that were also prototypes...
Top 24 - 12/33 = 36%
Top 12 - 7/33 = 21%
Top 5 - 4/33 = 12%
Top 24 - 12/33 = 36%
Top 12 - 7/33 = 21%
Top 5 - 4/33 = 12%
So pretty much no matter how you slice it, Bulletproof WRs are a cut-above.
But he's the consensus WR1 at this point Beancounter, we already love him.
But he's the consensus WR1 at this point Beancounter, we already love him.
And I would argue, not enough.
If you would kindly look to the far right of the attached image you will see the rookie year ppg for the Bulletproof+ contingent.
So this looking at production in the here and now for one Drake London.
So this looking at production in the here and now for one Drake London.
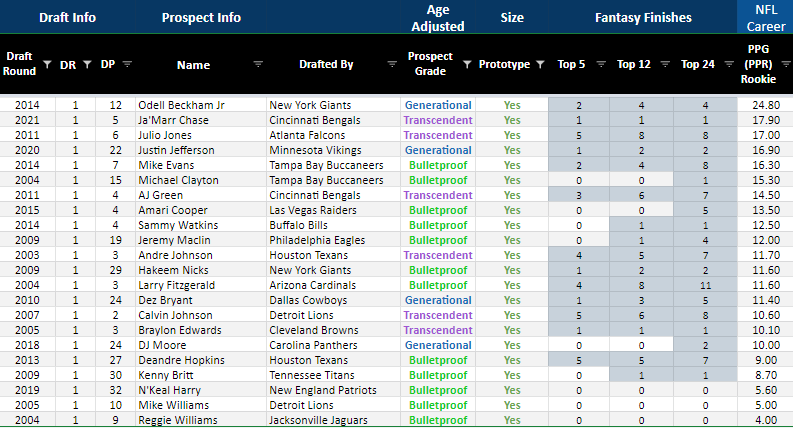
We have an average season long ppg for bulletproof+ WRs of 12.27.
We know that rookies tend to start slow and their production skews upward throughout the season.
We know that rookies tend to start slow and their production skews upward throughout the season.
Most of the folks I know play in leagues with 'playoffs' where points scored in the latter part of the season 'matter more' from a 'win your league perspective'.
There is a very reasonable chance that Drake is providing you starter points by the time your playoffs roll around.
There is a very reasonable chance that Drake is providing you starter points by the time your playoffs roll around.
I do not believe he is being treated like that in dynasty.
Furthermore, there is at least some precedent for difference making production within his rookie year.
Furthermore, there is at least some precedent for difference making production within his rookie year.
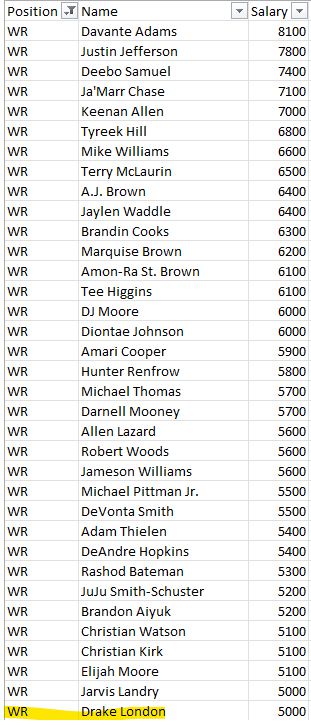
And then when we get to his redraft ADP per @FantasyPros we are looking at Drake being drafted among a whole bunch of WRs that may not outscore him on the entire year and almost assuredly will not down the stretch.
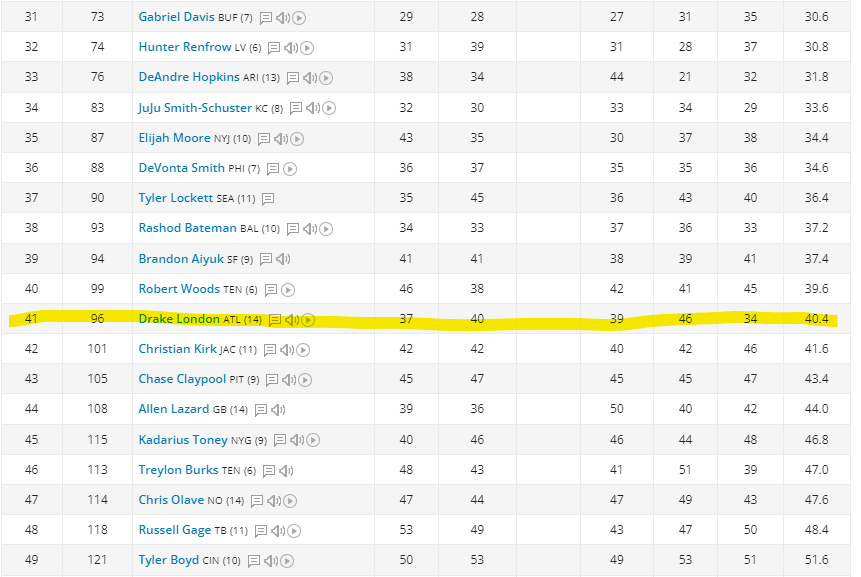
And there are players on this list that have near zero precedent for difference making production...
Like you are on the clock and choosing between Drake London and f*cking Christian Kirk, Allen Lazard, and Russell Gage?
What are we even doing here?
🤣😂
Like you are on the clock and choosing between Drake London and f*cking Christian Kirk, Allen Lazard, and Russell Gage?
What are we even doing here?
🤣😂
And then you want to tell me that there are 35 WRs more expensive than Drake London on week 1 @DraftKings
The dude is probably walking into a 20%+ target share in week 1 with the sky being the limit.
Like KJ f*cking Osborn is $100 less.
The world has gone mad.
The dude is probably walking into a 20%+ target share in week 1 with the sky being the limit.
Like KJ f*cking Osborn is $100 less.
The world has gone mad.
Anyway, If this is your jam, join me and the other analysts on the patrons discord at patreon.com/bulletproofFF
We have dynasty, devy, redraft, bestball, and DFS content and furthermore we even have position specific analysts and it is all based on stuff like this.
We have dynasty, devy, redraft, bestball, and DFS content and furthermore we even have position specific analysts and it is all based on stuff like this.
We will help you win your league... unless that look in the mirror I mentioned earlier revealed that you are just here for the vibes. 😋
@threadreaderapp unroll please
• • •
Missing some Tweet in this thread? You can try to
force a refresh


