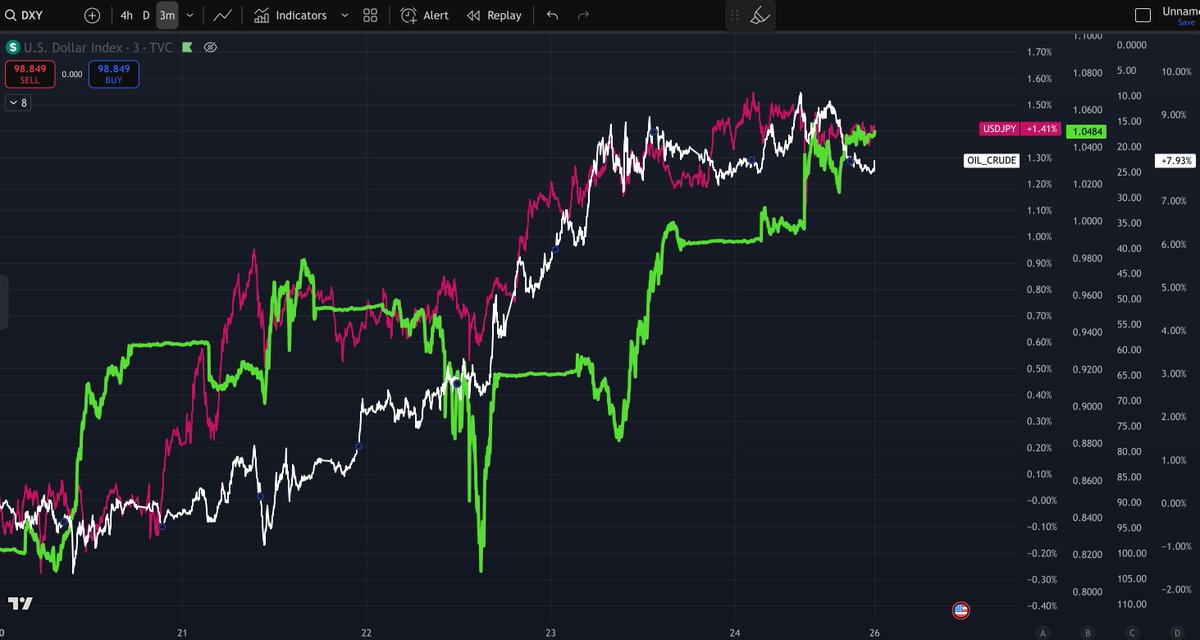
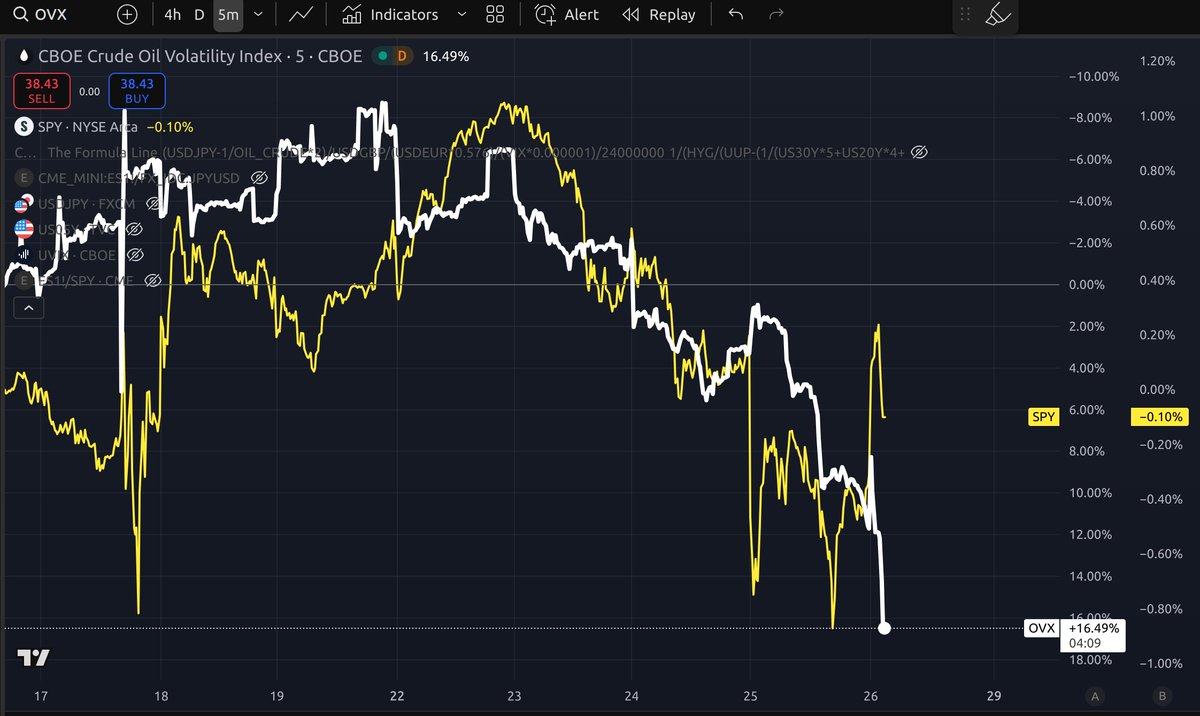
I want to talk about this - very important.
🧵👇
🧵👇
https://twitter.com/zerohedge/status/1561736260951187456
Remember when i said UVIX was created in march 2022?
Someone - likely a big hedge (for the pow) or japan - someone big is gaming the vix.
I firmly believe this is being done to whack futures pricing - it hits stonk futures, but also OIL futures.
Someone - likely a big hedge (for the pow) or japan - someone big is gaming the vix.
https://twitter.com/frankoz95967943/status/1561279285268058112?s=20&t=rlqrRYv_8Gtj6YQtUxpqgQ
I firmly believe this is being done to whack futures pricing - it hits stonk futures, but also OIL futures.
Sauds have now said enuf.
Hold on your popcorn boys and girls. If Saudis decide to cut production, its 1979 all over again.
Hold on your popcorn boys and girls. If Saudis decide to cut production, its 1979 all over again.
Everythings fun and games - retail gets hosed and no one cares.
But piss off your energy supplier, well, that could be kinda electrifying....
It will now be quite interesting to see what financial games G7 tries to play now.
But piss off your energy supplier, well, that could be kinda electrifying....
It will now be quite interesting to see what financial games G7 tries to play now.
And it gets better - so who could possibly be behind these financial vol games to suppress futures?
I will give you 3 guesses, but read this first...
qz.com/the-white-hous…
I will give you 3 guesses, but read this first...
qz.com/the-white-hous…
A reminder
MBS is going to punish biden....
MBS is going to punish biden....
Biden's party election prospects depend on 3 things:
1) Oil goes down
2) Stonks go up
3) Stability in all markets
By crushing the vix he achieves all 3.
He must have been advised by someone big on Wall St. and executed this plan.
Thats got to be it.
Game is almost over.
1) Oil goes down
2) Stonks go up
3) Stability in all markets
By crushing the vix he achieves all 3.
He must have been advised by someone big on Wall St. and executed this plan.
Thats got to be it.
Game is almost over.
its not just ZH thats reported this:
bloomberg.com/news/articles/…
bloomberg.com/news/articles/…
That chart smells like "desperation"
never in history has SPR been drained that fast.
Not ever.
And we arent even in a direct congress approved war yet.
Just imagine if THAT changed....
never in history has SPR been drained that fast.
Not ever.
And we arent even in a direct congress approved war yet.
Just imagine if THAT changed....
If you made it this far, I like you.
There is a lot on my pinned profile tweet - here is one of them.
I don't like any of US political leadership R or D over past 50y, but Biden?
Most people don't remember what a disaster this guy is.
A reminder...
There is a lot on my pinned profile tweet - here is one of them.
I don't like any of US political leadership R or D over past 50y, but Biden?
Most people don't remember what a disaster this guy is.
A reminder...
https://twitter.com/frankoz95967943/status/1541086958096486403?t=Js7pjOn1VFSG86ZVtDnccg&s=19
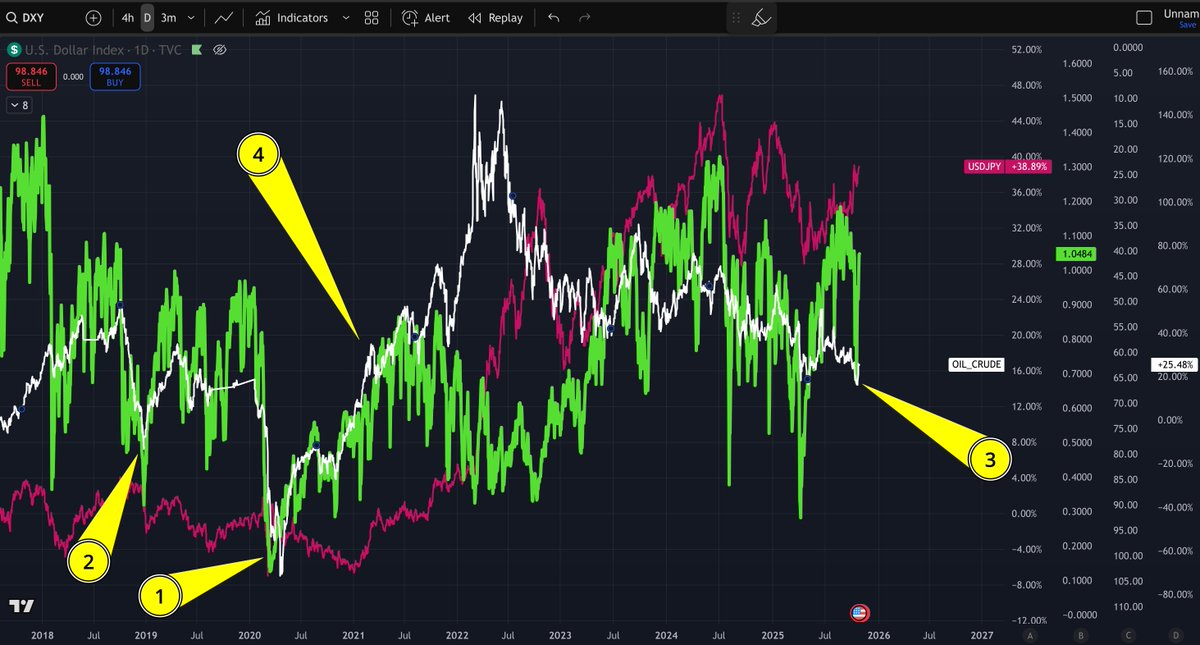
If you been watching the vix/uvix, you've probably noticed the ripples - well, these are correlated with oil futures.
It APPEARS to me that the swaps, uvix shorts stronger dollar games are used to attack oil when futures spike higher.
It APPEARS to me that the swaps, uvix shorts stronger dollar games are used to attack oil when futures spike higher.

• • •
Missing some Tweet in this thread? You can try to
force a refresh


