Recently, the Society of Actuaries published a 56-page data report that will likely be bias confirming to everyone. But I did the work to break this down. For you. Because I love you.
I love you.
soa.org/resources/expe…
I love you.
soa.org/resources/expe…

The actuaries made a video saying, "Look, the trend line shows that the excess mortality during the worst quarter was lower where more people were vaccinated," suggesting that the vaccines were at least somewhat effective.
3. But isn't that weird given that we're talking about Q3, which includes months no generally associated with death from respiratory viruses? Did they miss some kind of signal?
4. Ed Dowd points to the Q3 numbers and Bannon says, "This should be the front page of the NYT."
thevigilantfox.substack.com/p/smoking-gun-…
thevigilantfox.substack.com/p/smoking-gun-…
5. Unfortunately, neither side of the debate is clashing whatsoever. In other words, there is no debate at all. One screen, two films aimed at two bubbles.
Don't worry, I'm here to sort this all out.
Don't worry, I'm here to sort this all out.
6. First, I'll point out that deaths recorded as COVID were more numerous during the last three quarters of 2021 than those same quarters in 2020 by around 16%. This is not suggestive of high vaccine efficacy (VE).

7. But let's take a step back and take stock of all the news from health insurers this year.
8. In early January, we found out from a health insurer (One America) that non-COVID deaths among working age individuals in Indiana was at a statistically aberrant all-time high.
roundingtheearth.substack.com/p/why-are-non-…
roundingtheearth.substack.com/p/why-are-non-…
9. In early March, the CEO of German health insurance giant BKK presented evidence that the vaccines had already killed tens of thousands of Germans, and was fired the next day, the story paved over quickly.
roundingtheearth.substack.com/p/german-insur…
roundingtheearth.substack.com/p/german-insur…

10. Back in June, Lincoln National reported a 163% increase in death benefits paid out under its group life insurance policies during the whole of 2021.
crossroadsreport.substack.com/p/breaking-fif…
crossroadsreport.substack.com/p/breaking-fif…
11. On August 4, we got Reinsurance Group of America's (RGA's) financial reports showed 2021 losses downplayed by the report authors, plus plans for new accounting methods that we should all be worried are designed to sweep #iatrogenocide under the rug.
…nsurancegroupofamericainc.gcs-web.com/news-releases/…
…nsurancegroupofamericainc.gcs-web.com/news-releases/…

12. That was where we were when the latest Society of Actuaries report hit the ground, which shows group life insureds—particularly of working age—seeing even more excess mortality than the larger U.S. population!
13. In particular, the sharp numbers during Q3 2021 coincides with vaccine mandates for working age individuals.

14. Back to the actuaries...at just after 5:15 we hear, "those states having the higher vaccination rates showing a moderately lower excess mortality."
https://twitter.com/EduEngineer/status/1562734047537020928?s=20&t=AIruYSCxKbXKiIiVFaqA4w
15. But have they covered all the angles? When I look at this cart, I see (it screams really) a likely Simpson's paradox.

16. A Simpson's paradox is where a suggested data trend is the artifact of a confounding variable that needs correction. It can make trends appear entirely backward from their true causal nature.
researchgate.net/publication/25…
researchgate.net/publication/25…

17. And that's clearly stupid. The only alcohol associated with higher IQ is well aged highland scotch. Fight me.

18. Personally, I've previously observed wealth generating the illusion of VE. It makes sense to start there with a better statistical evaluation.
roundingtheearth.substack.com/p/a-mechanisti…
roundingtheearth.substack.com/p/a-mechanisti…
19. The state level data aggregates may obscure additional mis-aggregated data, so our cleaning of the data may not be perfect, but the clue that we're doing the right thing to check is that the northeastern dots are near the bottom-right while the southeastern dots are up-left.

20. Stepping back, we can compare both variables "median household income" and "June 30, 2021 vaccination rate" to...2019 excess mortality data. This is less weird than you think...

21. It's flat. A bit noisy, but mostly flat. This is because there is no causal relationship to vaccine status, and because wealth effects are obscured by the fact that "excess" mortality mean reverts! We do still see a soft downward slope indicating gradual upward mobility?
22. Now, look what happens when I draw in regional trend lines to the Q3 2021 shock quarter data. Most of the slope disappears. Why didn't the actuaries notice this? Was precoloring the demographics not enough to nudge them to check?

23. Okay...now I replace the SOA graph with my own new one comparing median HH income to Q3 2021 excess mortality. They look damn near the same!

24. The overall R^2 (correlation) fit in the regressions is nearly precisely the same. While we cannot expect the slopes to be the same due to a lack of unit comparison in the x-axis variables, the relationships are closer than I could possibly have predicted!
25. Not only that, the R^2 values in the scatter plot comparing household income to excess mortality are higher, indicating a stronger relationship between the variables. This is pretty strong evidence that wealth differentials drive the appearance of VE when data is aggregated.
26. Now, recall what I said about excess mortality being a statistic that should mean revert to a high degree? Let's take a step back in time and check out the Q2 2020 data:

27. These trend lines are largely sign-reversed from the post-vaccination data. The process of mean reversion should result in trend lines of substantially positive or negative slopes (*with respect to variables that don't have an effect on mortality) to flip-floping over time.
28. On a more practical level, the Northeast had higher C19 mortality earlier during the pandemic. We should expect relative mean reversion, which drives the sparse remaining efficacy illusion.
29. In totality, the summary differences between regions looks like exactly what you would expect knowing the black and hispanic Americans suffered the worst from COVID-19, and they are concentrated most in the South and second-most in the Northeast.

30. There is no reason left to suggest any of the excess mortality data trend is driven by vaccination, but every reason to think that it's almost entirely driven by the health effects associated with wealth.
31. The SOA actuaries performed none of this analysis before making a video saying that the aggregate state data trend line demonstrated a meaningful signal of vaccine efficacy.
Then again, Ed Dowd failed to hold their feet to the fire.
Then again, Ed Dowd failed to hold their feet to the fire.
32. We can continue to check my theory of wealth-driven illusory VE. I made more pretty pictures!
33. For the first quarter of 2022, the overall trend lines (dashed lines) are nearly a perfect match. The slopes are still negative, but more gently negative.

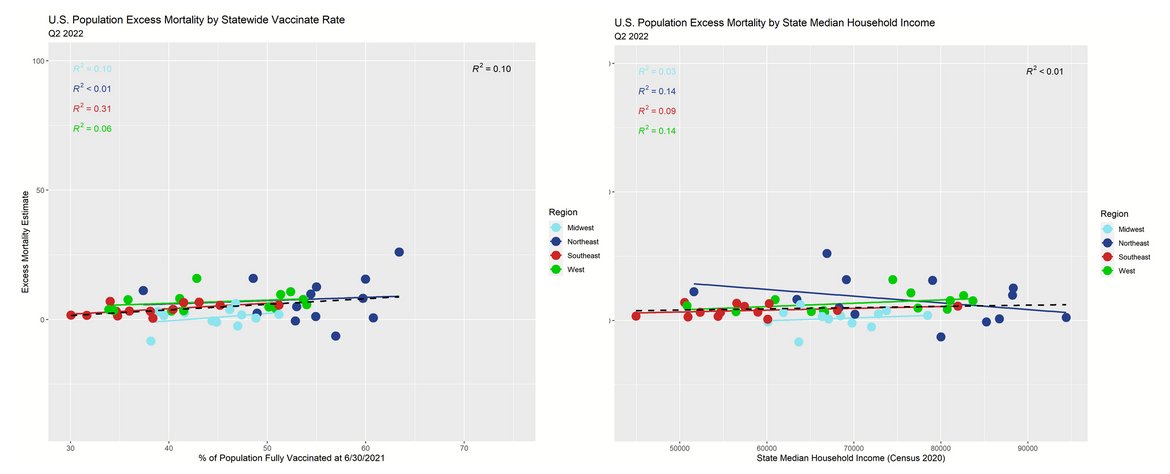
34. For the second quarter of 2022, the overall trend lines (dashed lines) are nearly a perfect match once again. Now the slopes are mostly slightly positive, but getting close to flat—just like they were in 2019 when there were no vaccines.
35. So, if there is no VE, what variable explains the Q3 2021 shock quarter?

36. Make up your own mind, but I've been working out the math for well over a year now.
campfire.wiki/doku.php?id=ro…
campfire.wiki/doku.php?id=ro…
37. My data sources are a bit sketchy: the CDC and the Census Bureau. We make do with what we can get.
roundingtheearth.substack.com/p/reanalysis-o…
roundingtheearth.substack.com/p/reanalysis-o…

• • •
Missing some Tweet in this thread? You can try to
force a refresh