The Basics of Profitability Ratios explained from Scratch 🧵🧵🧵🧵🧵🧵
In this Thread we will talk about:-
1. Gross Margins/Ebitda Margins/EBIT Margins & PAT Margins
2. Du Pont of ROA
3. Du Pont of ROE
4. Importance of ROCE
Retweet to educate Maximum Investors!!👇👇
In this Thread we will talk about:-
1. Gross Margins/Ebitda Margins/EBIT Margins & PAT Margins
2. Du Pont of ROA
3. Du Pont of ROE
4. Importance of ROCE
Retweet to educate Maximum Investors!!👇👇

What are Profitability Ratios?
Profitability ratios show how well a company is able to make profits from its operations, assets or shareholder's equity.
It also indicates how well the company utilises its assets to generate profits and provide value to its shareholders.
Profitability ratios show how well a company is able to make profits from its operations, assets or shareholder's equity.
It also indicates how well the company utilises its assets to generate profits and provide value to its shareholders.
The first ratio we are covering here is Gross Profit Margin.
GP Ratio is used to determine the efficiency of the business. It looks at how well company controls the cost of its inventory and the manufacturing of its products and subsequently passes on the costs to its customers.
GP Ratio is used to determine the efficiency of the business. It looks at how well company controls the cost of its inventory and the manufacturing of its products and subsequently passes on the costs to its customers.
Moreover, it also tells us the profitability of the value chain in which the company operates.
Eg:- 2 companies in the same industry will have very different Gross Margins.
Eg:- 2 companies in the same industry will have very different Gross Margins.
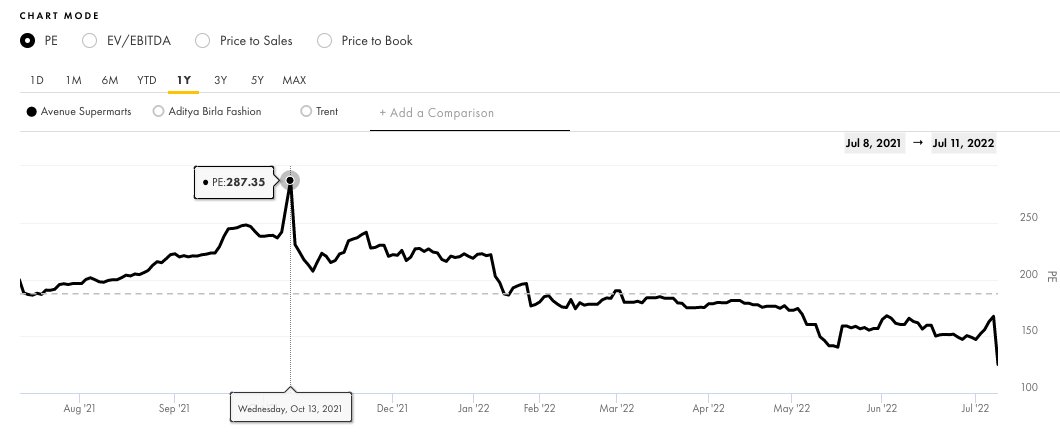
Company A has Gross Margins of 80% vs Company V having Gross Margins of 45%.
Just shows us Company A is operating in a much superior value chain and if Gross Margins do not fluctuate.
This is what we call Pricing power!
Just shows us Company A is operating in a much superior value chain and if Gross Margins do not fluctuate.
This is what we call Pricing power!
This Pharma Company has always operated between 73-75% Gross Margins 👇👇
What is the formula to calculate Gross Margins?
Gross Profit = Sales – Cost of Goods Sold (COGS)
Sales = Revenue from Operations
Gross Profit Margin = Gross Profit / Sales*100
Sales=Revenue from operations (Exclude Other income)
Gross Profit = Sales – Cost of Goods Sold (COGS)
Sales = Revenue from Operations
Gross Profit Margin = Gross Profit / Sales*100
Sales=Revenue from operations (Exclude Other income)
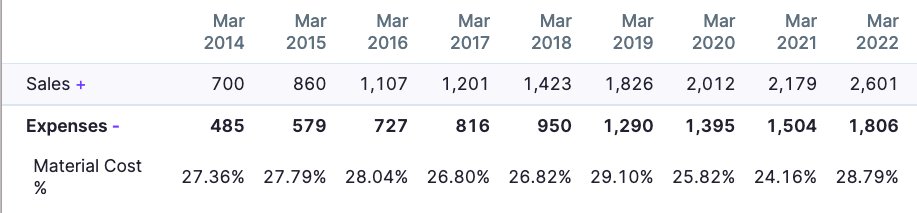
What are COGS or Cost of Goods Sold?
COGS represent the expenses involved in producing goods over a period of time.
It is calculated as Material consumed+ Purchases+Change in inventories
COGS represent the expenses involved in producing goods over a period of time.
It is calculated as Material consumed+ Purchases+Change in inventories
The next ratio we will be discussing is EBITDA Margins which is considered to be the cash operating profit margin of a company.
It is calculated as EBITDA/ Sales * 100
EBITDA = Gross Profit - Operating Expenses (also called Selling, General & Admin Expenses)
It is calculated as EBITDA/ Sales * 100
EBITDA = Gross Profit - Operating Expenses (also called Selling, General & Admin Expenses)
EBITDA eliminates the effects of non-cash expenses such as depreciation and amortization.
A low EBITDA margin indicates that a business has profitability problems and issues with cash flow. Whereas, a relatively high EBITDA margin means that the business earnings are stable.
A low EBITDA margin indicates that a business has profitability problems and issues with cash flow. Whereas, a relatively high EBITDA margin means that the business earnings are stable.
EBITDA Margins are useful for analysing companies which are in capex phase or companies where capex has recently commissioned but its capacity utilisation is low.
In such companies depreciation will be high hence net profit will be low.
In such companies depreciation will be high hence net profit will be low.
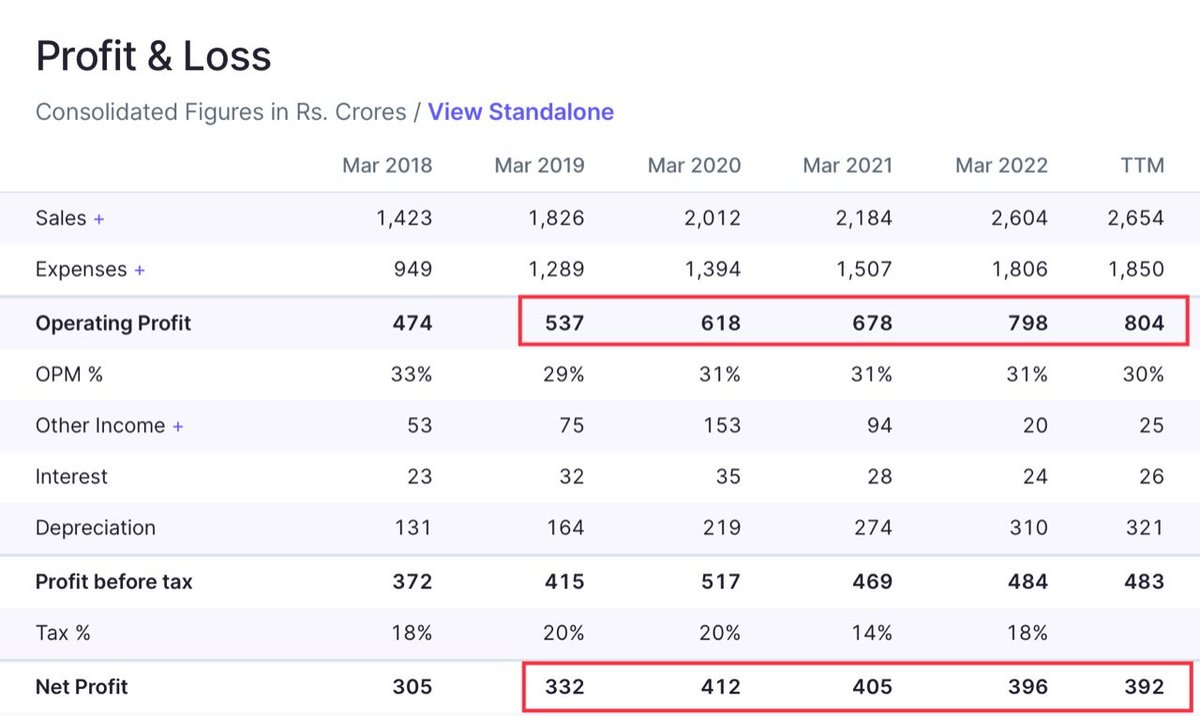
One such co is here which has commissioned its capex but awaiting regulatory approval, so here co is not generating any revenue from that plant but dep is hitting to P&L.
During FY19 to 22, its EBITDA has grown at CAGR of 14% but NP has grown at 6% only due to increase in dep.👇
During FY19 to 22, its EBITDA has grown at CAGR of 14% but NP has grown at 6% only due to increase in dep.👇
The next ratio is Operating Profit Margin which calculates how efficiently a company is able to generate profit through its core operations.
It is used to evaluate the company’s operating efficiency.
OPM is calculated as EBIT/ Sales
Where,
EBIT = EBITDA - Dep & Amortisation
It is used to evaluate the company’s operating efficiency.
OPM is calculated as EBIT/ Sales
Where,
EBIT = EBITDA - Dep & Amortisation
A higher ratio indicates that the company is well equipped to pay its fixed costs, interest cost, handle economic slowdowns.
These companies may also offer lower prices than its competitors at lower margins to grab market share from competitors.
These companies may also offer lower prices than its competitors at lower margins to grab market share from competitors.
Another ratio is net profit margin, which measures how much net income or profit is generated as a percentage of revenue.
It is the ratio of net profits to revenues for a company or business segment.
It shows how effectively a business can convert sales into net profit.
It is the ratio of net profits to revenues for a company or business segment.
It shows how effectively a business can convert sales into net profit.
NPM is calculated as Profit After Tax / Sales
Higher NPM indicates, company is operating well while managing its costs & pricing.
One drawback of using this ratio is it includes one time expenses & gains, making it hard to compare performance with its competitors
Higher NPM indicates, company is operating well while managing its costs & pricing.
One drawback of using this ratio is it includes one time expenses & gains, making it hard to compare performance with its competitors
Now lets do the Du Pont of Return on Assets & Return on Equity!
“Capital allocation decisions are amongst the most important decisions which management of companies make on behalf of shareholders.” -
Terry Smith
“Capital allocation decisions are amongst the most important decisions which management of companies make on behalf of shareholders.” -
Terry Smith
First we will be discussing is Return on Assets
ROA measures how well a company uses its assets to generate profits. It focuses on how much profit it generates on every rupee invested.
It is calculated as ROA = Net Profit / Total Assets
ROA measures how well a company uses its assets to generate profits. It focuses on how much profit it generates on every rupee invested.
It is calculated as ROA = Net Profit / Total Assets
ROA measures the asset intensity of the company.
The higher the percentage, the better, because that means the company is doing a good job using its assets to generate sales.
Thus, a lower ROA indicates a more asset-intensive company.
The higher the percentage, the better, because that means the company is doing a good job using its assets to generate sales.
Thus, a lower ROA indicates a more asset-intensive company.
On the contrary, a higher ROA indicates more profitability against the company’s number of assets to operate.
Moreover, companies with higher asset intensity must invest a significant amount in machinery and equipment to generate income like telecom, infra, railroads, etc.
Moreover, companies with higher asset intensity must invest a significant amount in machinery and equipment to generate income like telecom, infra, railroads, etc.
ROA is one of the most important parameter for analysing financial companies like Banks and NBFC, as these are leveraged businesses the ROA here will be low.
Investors reward companies with High ROA.
Investors reward companies with High ROA.
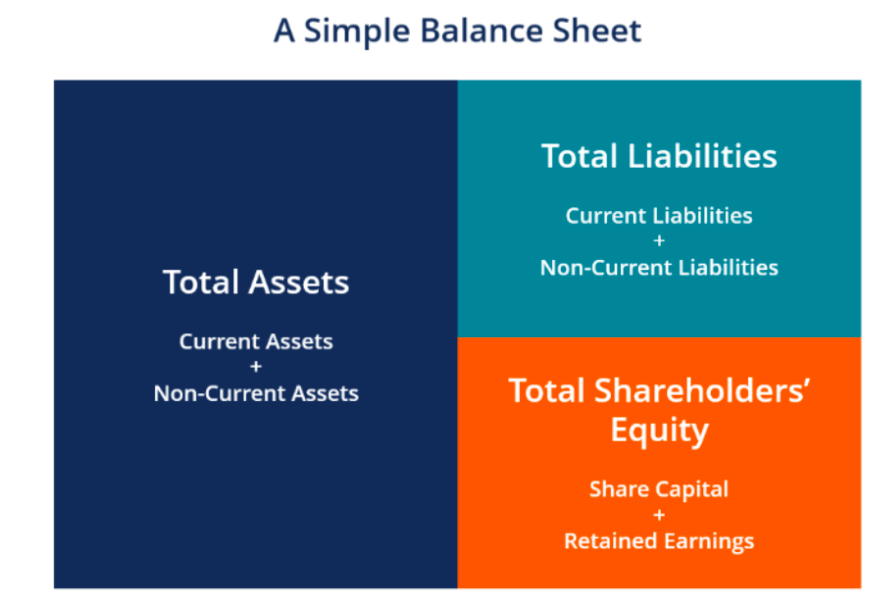
The next ratio which we will be discussing is Return on Equity.
ROE measures how well a company can use its shareholders’ money to generate profits.
The formula of ROE is Profit after Tax ÷ Equity (Net worth)
Where,
Net worth = Equity share capital, and Reserve and Surplus
ROE measures how well a company can use its shareholders’ money to generate profits.
The formula of ROE is Profit after Tax ÷ Equity (Net worth)
Where,
Net worth = Equity share capital, and Reserve and Surplus
ROE indicates the returns on the sum of money the investors have invested in the company
Companies with a high ROE can generate cash internally and thus they will be less dependent on debt
ROE must be compared to the historical ROE of the company & to the industry’s ROE average
Companies with a high ROE can generate cash internally and thus they will be less dependent on debt
ROE must be compared to the historical ROE of the company & to the industry’s ROE average
Investors should not make any investment decision on the basis of ROE alone as it may not give a clear picture because debt is not considered here
Companies with high debt may report high ROE
Hence it becomes extremely important to look leverage as well and do the dupont of ROE
Companies with high debt may report high ROE
Hence it becomes extremely important to look leverage as well and do the dupont of ROE
Dupont of ROE simply means breaking the ROE formula into 2 parts i.e,
ROE = ROA x Financial Leverage
Where,
Financial Leverage is calculated as Total Assets / Equity
If leverage is high then it means the company has high debt in the books.
ROE = ROA x Financial Leverage
Where,
Financial Leverage is calculated as Total Assets / Equity
If leverage is high then it means the company has high debt in the books.
Lets understand the dupont of ROE with few examples
A steel wire company which was heavily leveraged till FY19 its D/E was 4.56 times, in FY20 co sold its steel plant and paid off most of its borrowings which brings down its debt from 3565 cr to 620 cr in FY20 & currently 411 cr
A steel wire company which was heavily leveraged till FY19 its D/E was 4.56 times, in FY20 co sold its steel plant and paid off most of its borrowings which brings down its debt from 3565 cr to 620 cr in FY20 & currently 411 cr
The impact of that has been shown in ROE as Net Profit margin has increased from 2% in FY19 to 11% in FY22 and financial leverage came down from 9 times in FY19 to 1.61 times in FY22.
Total Asset turnover also came down bcz company became asset light as steel plant gone from BS.
Total Asset turnover also came down bcz company became asset light as steel plant gone from BS.
The ROE of the company went up from 6% in FY19 to 17% in FY22.
Net impact:
Total Asset Turnover 🔼 sale of plant
Net Profit Margin 🔼 interest cost came down
Financial Leverage 🔽 due to debt repayment
ROE = NPM x Total Asset Turnover x Financial Leverage
Return on Equity ⏫
Net impact:
Total Asset Turnover 🔼 sale of plant
Net Profit Margin 🔼 interest cost came down
Financial Leverage 🔽 due to debt repayment
ROE = NPM x Total Asset Turnover x Financial Leverage
Return on Equity ⏫
The next example here is of a chemical company which has done a huge capex in FY19 to set up a new plant.
The impact of that was during capex phase company has debt of 1187 cr in FY19 impacting its ROE as financial leverage was high and Total Asset turnover was low due to CWIP.
The impact of that was during capex phase company has debt of 1187 cr in FY19 impacting its ROE as financial leverage was high and Total Asset turnover was low due to CWIP.
Post commencement of the phenol plant, the revenue of company has increased from 1650 cr in FY18 to 4360 in FY21.
Operating leverage kicked in and its net profit margins increased from 5% in FY18 to 18% in FY21.
Company reduced its debt from 1186 cr to 590 cr in FY21.
Operating leverage kicked in and its net profit margins increased from 5% in FY18 to 18% in FY21.
Company reduced its debt from 1186 cr to 590 cr in FY21.
The overall impact on ROE:
ROE = NPM x Total Asset Turnover x Financial Leverage
Here also ROE expanded from 9% in FY18 to 33% in FY21
Net impact:
Total Asset Turnover 🔼 due to jump in revenue
Net Profit Margin 🔼 due to operating leverage
Financial Leverage 🔽 as debt repaid
ROE = NPM x Total Asset Turnover x Financial Leverage
Here also ROE expanded from 9% in FY18 to 33% in FY21
Net impact:
Total Asset Turnover 🔼 due to jump in revenue
Net Profit Margin 🔼 due to operating leverage
Financial Leverage 🔽 as debt repaid
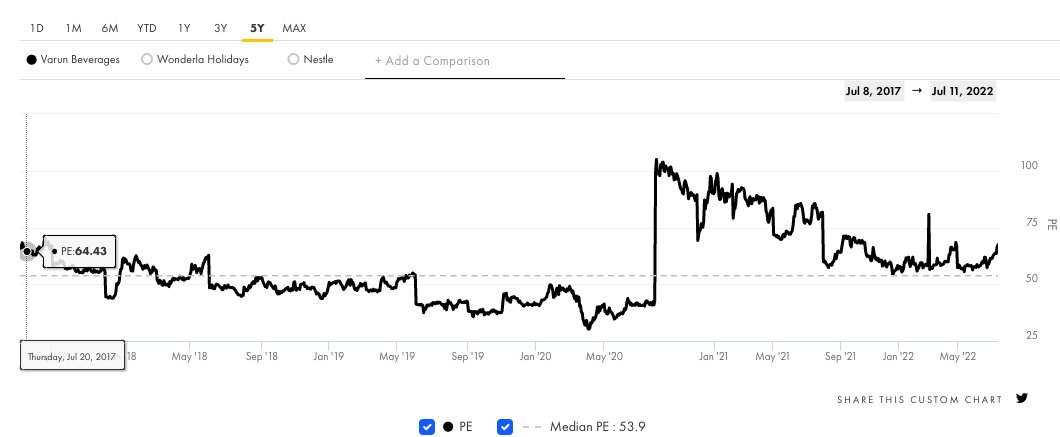
Another example which we can cover here is a power exchange company which has been earning very high ROE because of the nature of business as it is an asset light business so there is no leverage and profit margins are also very high.
So it is like a cash throwing machine.
So it is like a cash throwing machine.
Problem with such business model is that once the business matures it becomes hard to find incremental investment opportunities for co
Since opportunities are low so they will invest money in other low return options or give back the money to shareholders via dividend or buyback
Since opportunities are low so they will invest money in other low return options or give back the money to shareholders via dividend or buyback
On the coming Sunday I am doing a class on Income Statement and Ratio analysis of multiple Indian Companies :)
If you wish to attend, register from the link below:
rzp.io/l/NGWbwm5r
(Have intentionally kept the fee reasonable, masses can benefit)
If you wish to attend, register from the link below:
rzp.io/l/NGWbwm5r
(Have intentionally kept the fee reasonable, masses can benefit)

• • •
Missing some Tweet in this thread? You can try to
force a refresh