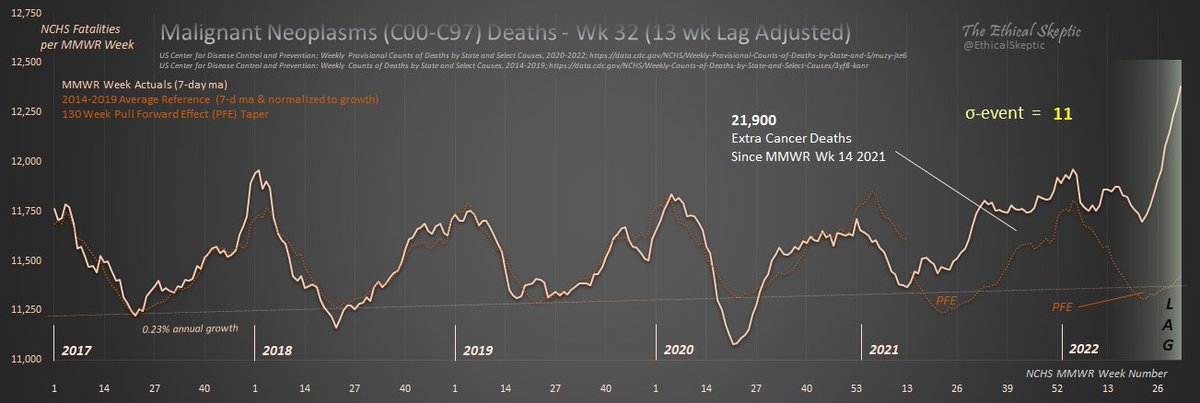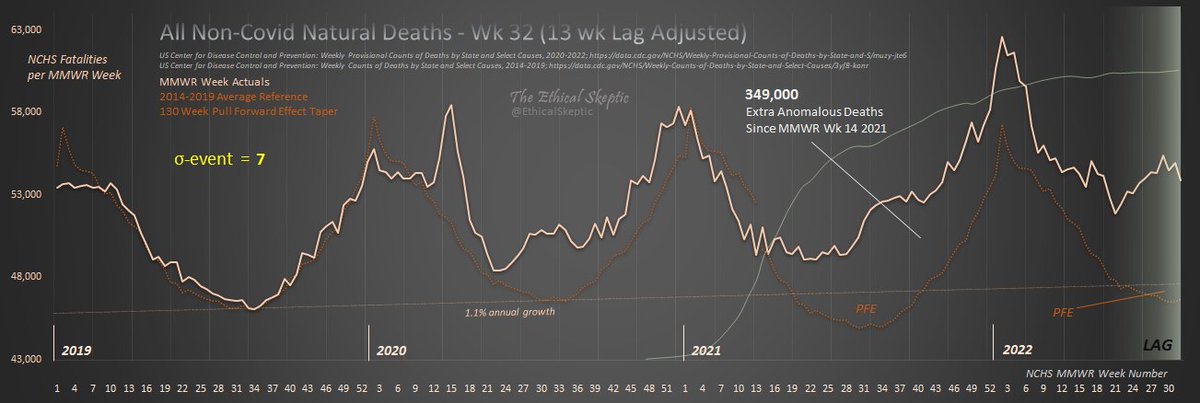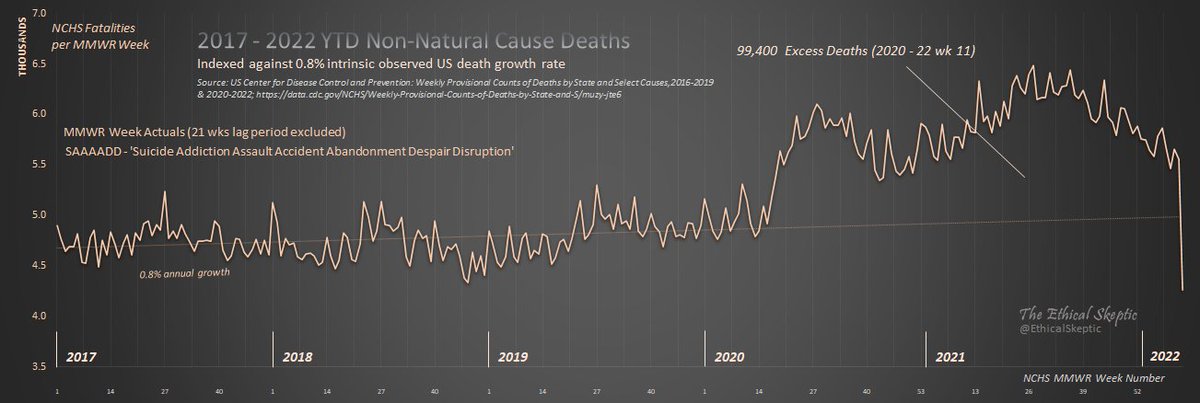
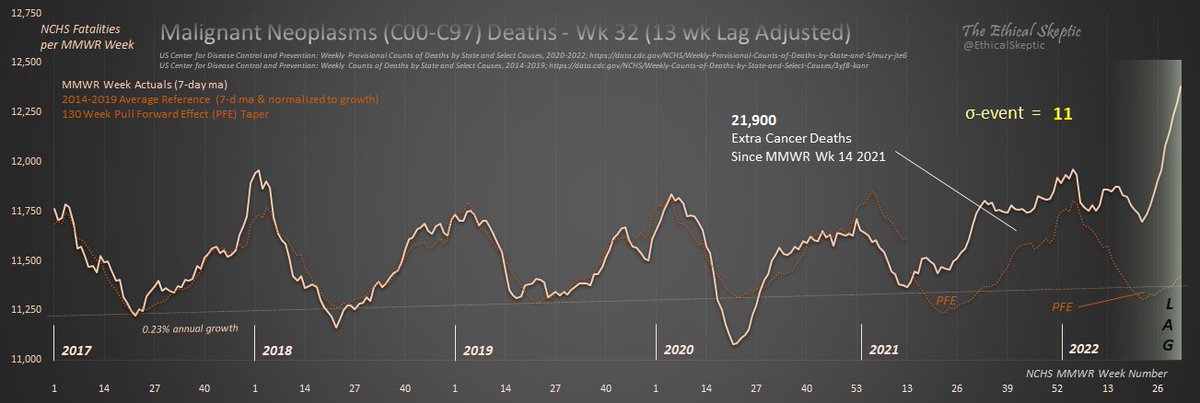
Recently a person claiming to represent 'Covid Science' did a sleight-of-hand hack job on my Cancer tracking chart that I derive from CDC data.
We take you through that parade of deception & incompetence in 5 panels, after exemplifying how this work is professionally done below.
We take you through that parade of deception & incompetence in 5 panels, after exemplifying how this work is professionally done below.
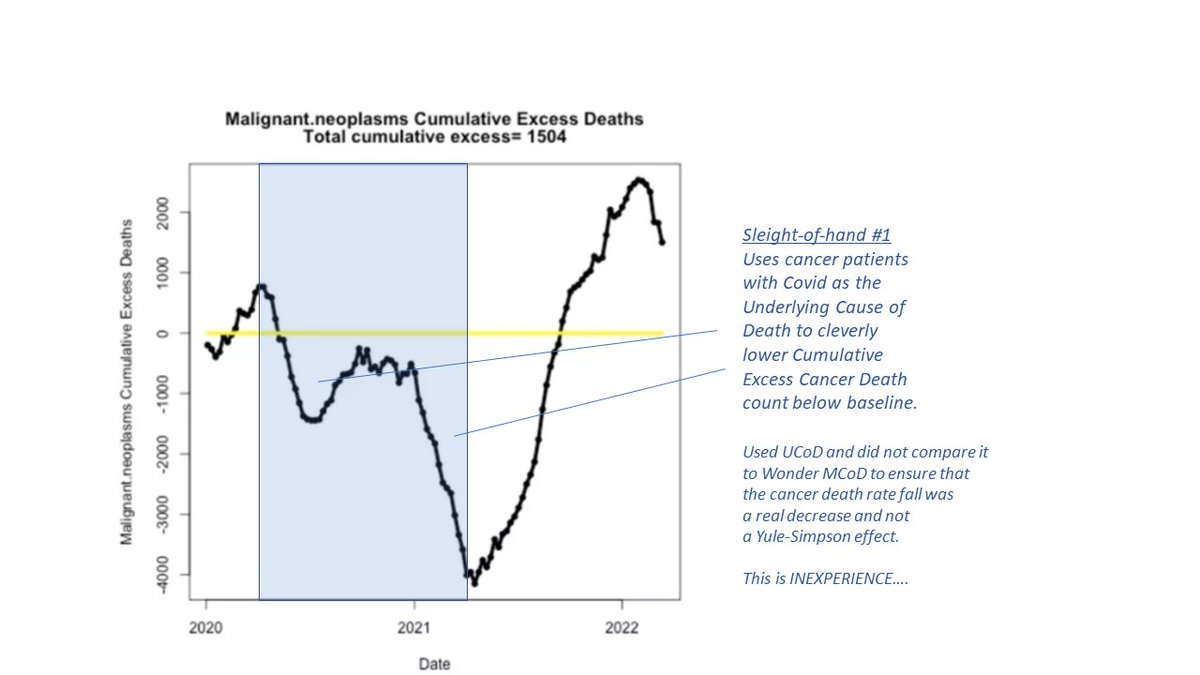
The 1st sleight-of-hand he used involves decrementing UCoD depressed cancer deaths from the totals.
He failed to us the Wonder Database to double-check and see if the lowered Cancer death rates were real, or merely an Underlying Cause of Death effect (i.e. Died 'with' Covid).
He failed to us the Wonder Database to double-check and see if the lowered Cancer death rates were real, or merely an Underlying Cause of Death effect (i.e. Died 'with' Covid).
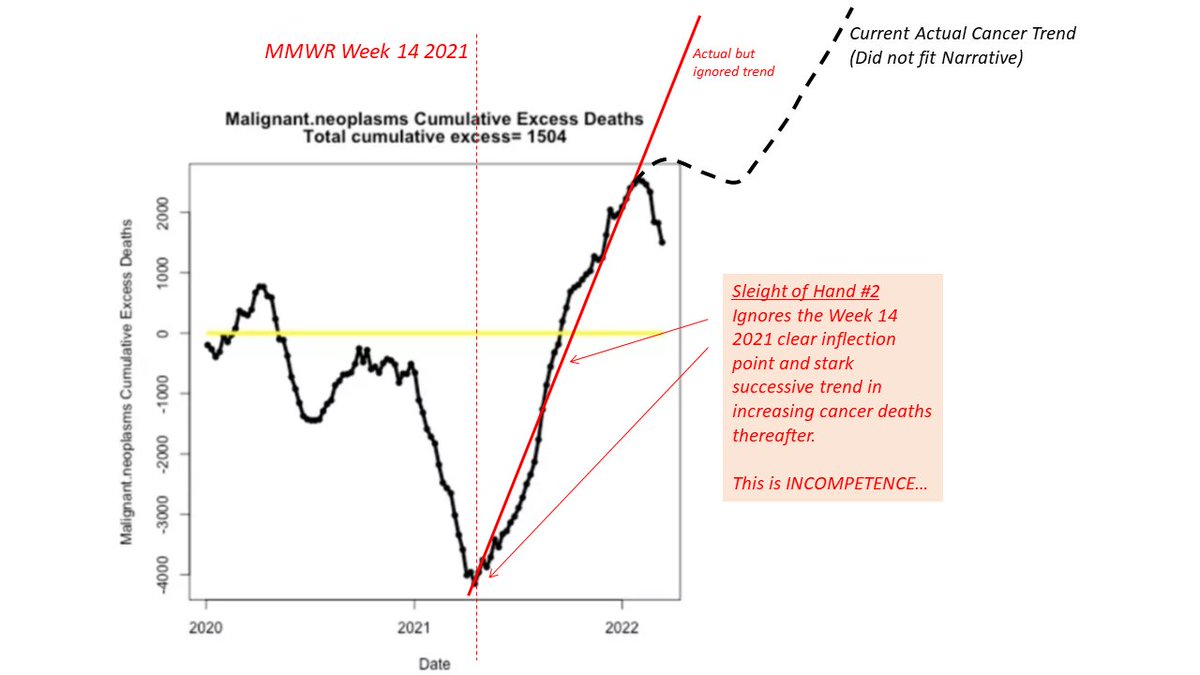
His 2nd sleight-of-hand involved obscuring the clear MMWR Week 14 inflection, the stark increase in cancer deaths thereafter, & then denying that it has occurred at all.
Yet there it is on his chart - my very point.
Obtuse? Malicious? Both when you claim to be 'Covid Science'.
Yet there it is on his chart - my very point.
Obtuse? Malicious? Both when you claim to be 'Covid Science'.
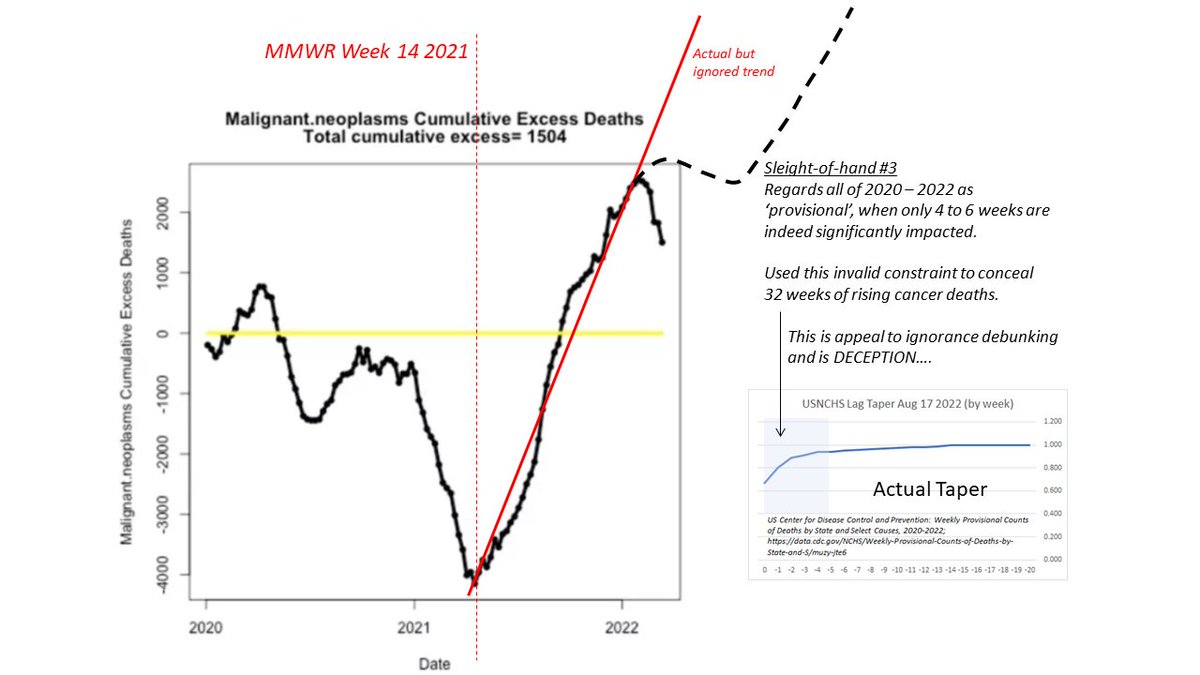
The 3rd sleight-of-hand used is to appeal to provision. Here he cherry picks a relevant date range which best frames the picture he wants to paint, rather than 'to date'. He is 'debunking'.
One can read how debunking (fake science) works in this article:
theethicalskeptic.com/2021/07/03/the…
One can read how debunking (fake science) works in this article:
theethicalskeptic.com/2021/07/03/the…
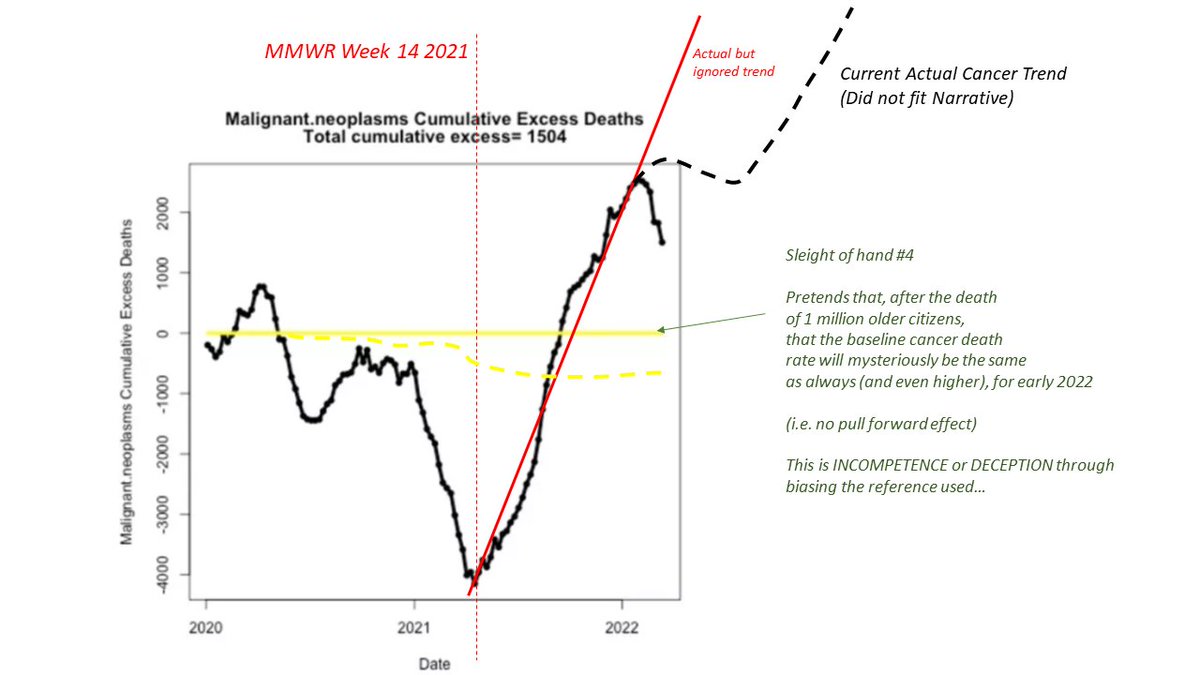
The 4th sleight-of-hand used - he pretended that 1 million early-death older citizens, would in no way lower the cancer death base rate in 2022 (not that one needs that count to make the argument).
Despite my explaining this (& all these 5 points) to him several times via email.
Despite my explaining this (& all these 5 points) to him several times via email.
And finally the pièce de résistance - he truncates the 32 recent weeks of cancer rise & pretends they don't exist (because they abjectly falsify his narrative).
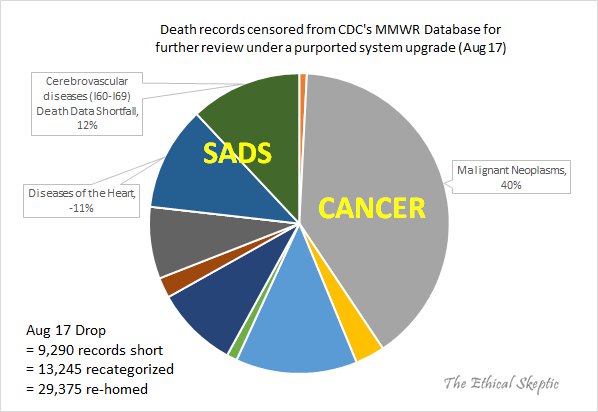
Then he employs the CDC 23 K record redaction to create a false ¡downturn! in cancer death rate at the 'end' (week 6)
Then he employs the CDC 23 K record redaction to create a false ¡downturn! in cancer death rate at the 'end' (week 6)
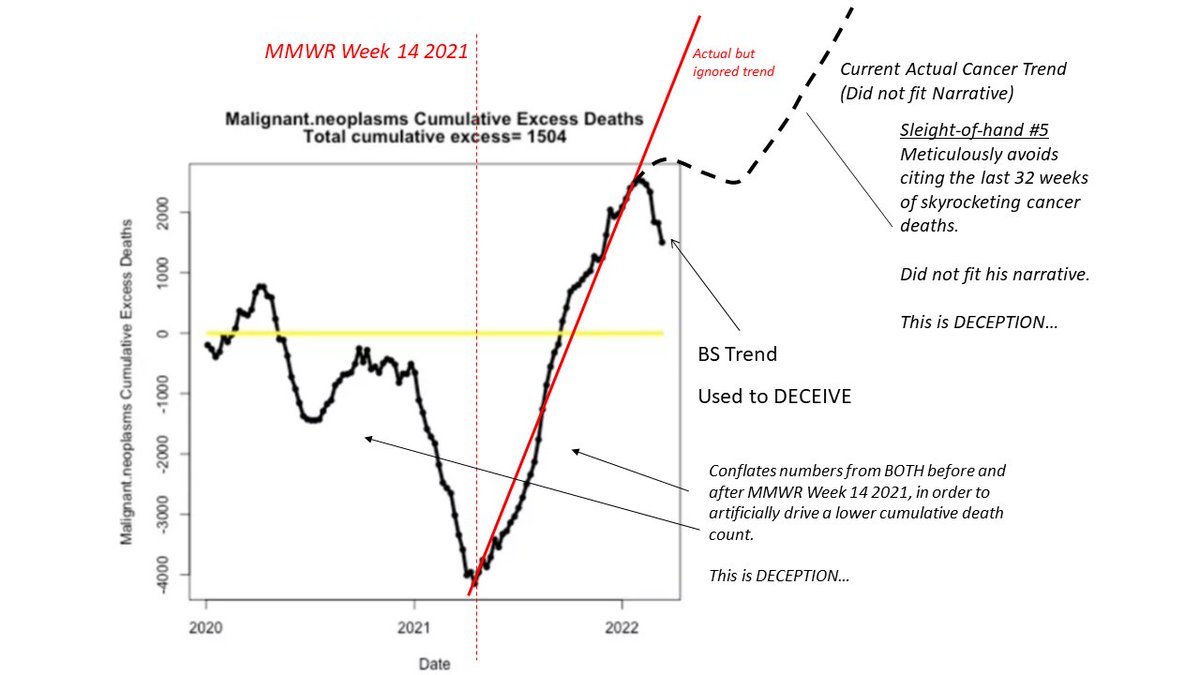
Folks, that is a five step journey into how an academic, who just recently set out on a club-incentivized debunking foray - reveals both a lack of comprehension and background in the data, along with the desire for a quick victory, and magician's rush of crowd deception/approval.
Below, I leave you with the Cancer entropy chart, and several other charts this gentleman does not know how to do - that also dramatically back up my inference to date (I have not made a final conclusion just yet)....
Thank you,
TES


Thank you,
TES


If you would like to read my article, where I outlay every data source, every step, and every, calculation - that can be found below.
Thanks again,
TES
theethicalskeptic.com/2022/08/20/hou…
Thanks again,
TES
theethicalskeptic.com/2022/08/20/hou…
• • •
Missing some Tweet in this thread? You can try to
force a refresh


