Christopher Ullery Profile picture
Aug 27, 2022 16 tweets 8 min read Read on X
By request of @jgcOCANADA I wanted to take a little bit of a closer look at our post-Dobbs spike in PA, this time by municipality. This is an extension of last week's thread here
I could start with #BucksCounty but I thought it'd be more interesting to look at the SEPA region of Philly, Bucks, Chester, MontCo and DelCo. Like most of the state, Dems have seen the biggest increases after Dobbs overall. 2/16
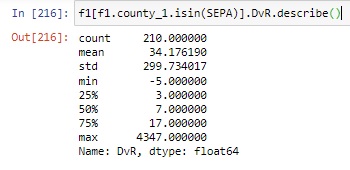
The main formula I use is NewDems - NewGOP (DvR), if the number is negative then more Republicans were added. I like my color bars to divide at 0, so I like to make the maximum value the absolute value of our minimum. 3/16
The reason I'm explaining that is to also explain how that previous map is a little skewed here. The highest Republican gains seen in this region was 5 voters, but a -5 to 5 color bar would have heavily skewed the Dems 4/16
So, while this map tells you the basic information that an overwhelming number of new Dems have registered to vote compared to Republicans since Dobbs, it doesn't really put it into perspective. 5/16
First, this is what our DvR is for total voters registered prior to Dobbs. Philly is the Dem stronghold, and the closer the municipality is to Philly, the bluer it tends to be. That Blue streak in ChesCo follows Route 30, btw. I just think its neat 6/16
Also, this is a choropleth map and land doesn't vote, so keep that in mind. Overall, the region generally has a fairly strong GOP presence outside of Philadelphia, mostly in Central and Upper Bucks, upper MontCo and throughout ChesCo and DelCo 7/16
Side by side, before and after Dobbs, the spike doesn't change the overall party demographics. As in my previous thread, it's interesting to see but turnout is all that matters here. 8/16
GOP voters saw some growth throughout the region, albeit most towns saw an average of 10 new Republican voters since Dobbs. However, it does look like the places that saw the most gains are in the same towns with more Dems overall. Deviation from ave was about 44 voters 9/16
This map shows new Dems in SEPA, but I'm using the same scale as the new Republicans for context. On average, Democrats grew by 44 voters per town, roughly 100 times that in Philly. Much of those leads, though, were in Dem strongholds. 10/16
The stats for both parties shows the Dems have grown at a larger rate than GOP voters for sure, but overall it's more like a growth for the status quo before Dobbs than a red, blue or even purple wave of new voters. 11/16
Let's keep that in mind as we look at the state. A couple notes about this map first. The color scale is based on the average number of voters per town excluding Allegheny and Philadelphia. Including them turned most red areas white. 12/16
Real quick though, let's talk about this Pennsyltucky bullshit I keep hearing about. The average DvR without Philly and Allegheny is -56 and 207 with them. Yes, most towns between the major cities lean right, but it's a marginal split. Maybe Pennsylginia? Anway ... 13/16
The post-Dobbs spike wasn't seen in every town, but where it did hit it seems to have followed the same trend as the SEPA region. Dems saw their highest gains in towns where they were already leading and GOP saw some very modest gains elsewhere. 14/16
None of this is really earth shattering news, but I never miss a chance to nerd out on some maps. Anway, Pennsylginia, think about it. 15/16
As always, data is analyzed using @PythonPr @geopandas @matplotlib in a @ProjectJupyter notebook. @threadreaderapp Unroll please. 16/16

• • •

Missing some Tweet in this thread? You can try to force a refresh
 

Keep Current with Christopher Ullery

Christopher Ullery Profile picture

Stay in touch and get notified when new unrolls are available from this author!

Read all threads

This Thread may be Removed Anytime!

PDF

Twitter may remove this content at anytime! Save it as PDF for later use!

Try unrolling a thread yourself!

how to unroll video
  1. Follow @ThreadReaderApp to mention us!

  2. From a Twitter thread mention us with a keyword "unroll"
@threadreaderapp unroll

Practice here first or read more on our help page!

More from @ulleryatintell

Feb 21
Some Beaver County residents in the South Side Area School District might be interested to know three policies are on the agenda tonight about bathrooms, sex-based distinctions on sports teams and requiring parents be informed if a student wants to use a different name or gender
It's something I'm very familiar with. We've seen policies like these crop up across the state since at least last year. Now, it'd be one thing if these were naturally occuring policies within a community, but I don't think that's the case. Let me show you something... Image
This is the metadata of that document. Note that name. JSamek. That's Jeremy Samek of the Independence Law Center, a religious liberty law firm that often works with districts to pass conservative policies without the public's knowledge. Image
Read 8 tweets
Jan 8
Got held up with a few things (and a recount delayed this way back) but I finally got to sit and analyze the voter rolls in Bucks. For brevity's sake, the story below focused on Central Bucks and Pennridge but ...🧵
bit.ly/4aOheJ9
Image
There was so much stuff I didn't get to dive into that I love talking about.
First, these are the voting precincts shaded by towns based on higher percentage of Dems or Reps on their voter rolls.
Upper Bucks is more rural, land doesn't vote people do yadda yadda moving on 🧵2/? Image
Same map, but this is based on School Districts. Pennridge is the reddest school district in Bucks, with the % of GOP voters over 16 points higher than % of Dems. CBSD is GOP led by just 3.22 points.
Bucks is a "blue" county by a thin margin of 3,500 voters total as of 12/25🧵⏭️ Image
Read 15 tweets
Nov 27, 2023
Almost two months ago, @willcarless, @aliaemily and I wrote this story about the influence the website BookLooks (BL) has on library challenges across the country. I thought I'd take another look at how the site has grown since then 1/??? bit.ly/3LOjcyG
Image
By way of background: BookLooks included reviews for about 630 titles as of Sept. 7, about 40% citing "alternate" sexualities or gender identities to justify their placement on a 0 to 5 rating scale. All but 131 books contained "sex" or "gender" in their concern summaries. 2/???
Image
Image
Overall, I'd say the site has been growing about as steady as it always has in, what I'll call the "off season." It looks like July through Oct. 2022 is about the same as July - Oct. 2023. Jan through March (muni election primary season) was busy 3/?🏍️. Image
Read 12 tweets
Nov 12, 2023
In about 12 hours, three stories will go live by @BethMRodgers and I based on a review of what we found when we searched "transgender" in school district policies across the state. You can read those tomorrow morning, but for now I wanted to explain how we did it. 1/11
This project first started with our work looking into how a religious liberty law firm and its parent group have been influencing school districts behind the scenes. 2/11 bit.ly/3N2HUfF
Image
I first stumbled on to them thanks to some leaked documents on Central Bucks' July 2022 library policy. After that, we started filing RTK requests in a hodgepodge of school districts where we thought ILC might be. It was a slow process. 3/11 bit.ly/3DopPDy
Image
Read 11 tweets
Nov 4, 2023
Pending an appeal or some unforeseen legal challenge, Central Bucks will go from a nine-region district to a three region district to elect its nine-member board in 2025. This story includes a region map w/precincts and an election schedule. But ...🧵 1/12 bit.ly/3G4zpfT
Image
"Friday was a busy day for me (finished this campaign finance story with @JoCiavaglia) and I wasn't able to delve too deep into
how these three regions change the political landscape in CBSD 2/12" bit.ly/3u1dXWe
Image
This is how Central Bucks is currently divided up. Each region is a different shade and the boundaries here are the 49 voting precincts in the district. Only Doylestown, New Britain and Chalfont boroughs are kept in a single district. Every town is split between regions. 3/12 Image
Read 12 tweets
Oct 5, 2023
Just in time for #BannedBooksWeek, @willcarless @aliaemily and I delved into BookLooks, a content rating website with ties to Moms for Liberty and a vital tool in a movement to ban books in public libraries. Check it out! Now, a 🧵 on how we did it 1/20bit.ly/3LOjcyG
BookLooks has been something I've wanted to dig into more since I wrote this column in June (more info on comic book censorship from @CBLDF btw). It seemed like all the "obscene" books in viral board meeting videos were on that list of over 550 titles 2/20bit.ly/3IDupAe
At the time, I was only able to scrape the basic info off of the BookLooks website's index. So, I knew the titles, authors and the ratings it gave each book. If I wanted to know more about what made the book so controversial, I'd have to open each PDF and read through it. 3/20 Image
Read 21 tweets

Did Thread Reader help you today?

Support us! We are indie developers!


This site is made by just two indie developers on a laptop doing marketing, support and development! Read more about the story.

Become a Premium Member ($3/month or $30/year) and get exclusive features!

Become Premium

Don't want to be a Premium member but still want to support us?

Make a small donation by buying us coffee ($5) or help with server cost ($10)

Donate via Paypal

Or Donate anonymously using crypto!

Ethereum

0xfe58350B80634f60Fa6Dc149a72b4DFbc17D341E copy

Bitcoin

3ATGMxNzCUFzxpMCHL5sWSt4DVtS8UqXpi copy

Thank you for your support!

Follow Us!

:(