If you pick stocks, you MUST learn how to read an income statement.
Here’s everything you need to know:
Here’s everything you need to know:
The income statement shows a company’s revenue and expenses over a period of time, usually a quarter or year.
It’s also called:
▪️Profit and Loss statement, or “P & L”
▪️Statement of earnings
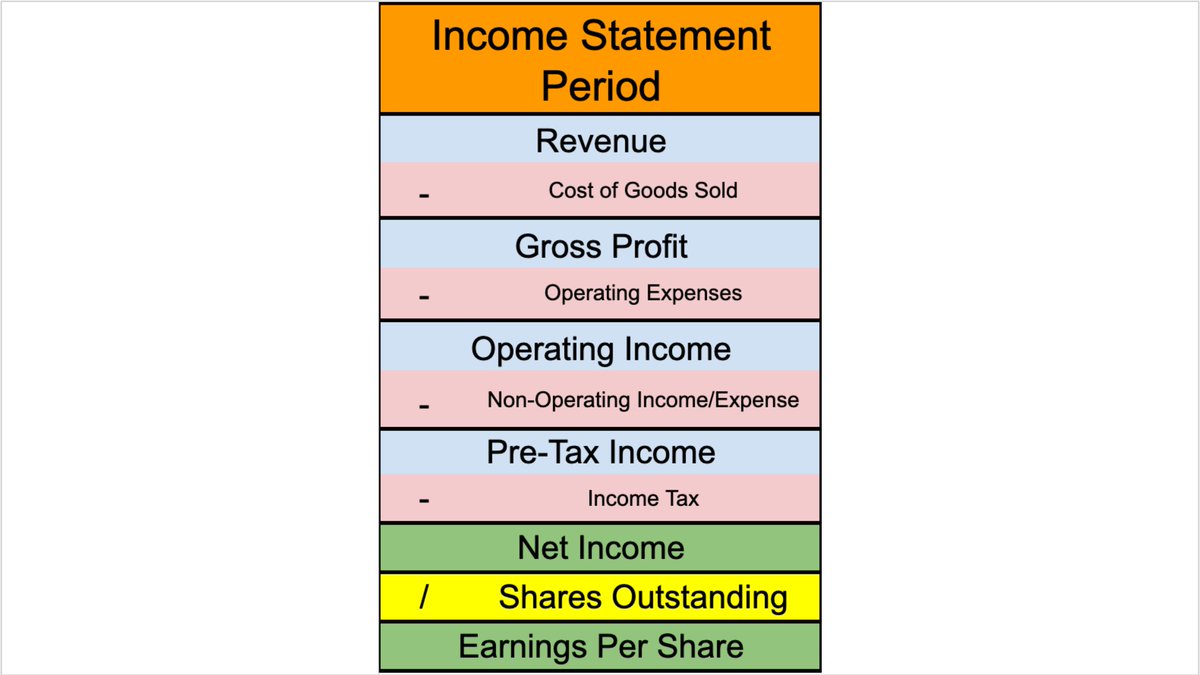
It follows this basic format:
It’s also called:
▪️Profit and Loss statement, or “P & L”
▪️Statement of earnings
It follows this basic format:
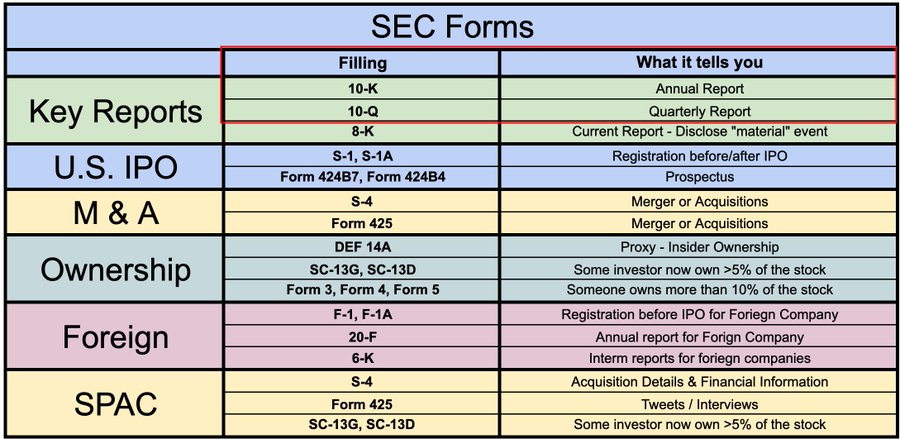
Most public companies show their income statement in their quarterly earnings press release, but not always
Find them by looking at:
▪️10-Q (quarterly report)
▪️10-K (annual report)
▪️Aggregator websites like @theTIKR
Find them by looking at:
▪️10-Q (quarterly report)
▪️10-K (annual report)
▪️Aggregator websites like @theTIKR
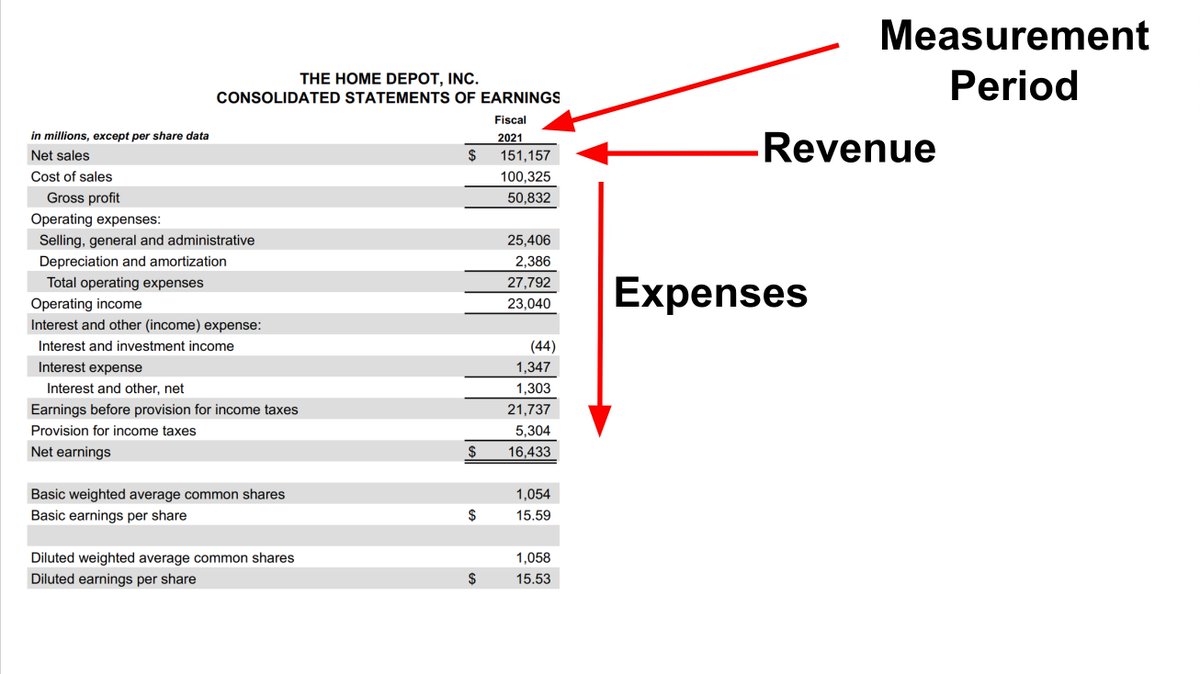
Let's use Home Depot fiscal 2021 as an example
Step 1: Get the data
▪️ Go to sec.gov
▪️ Search "HD"
▪️ Click the "10-K" from March 23rd
▪️ Scroll to "Statement of earnings"
Step 1: Get the data
▪️ Go to sec.gov
▪️ Search "HD"
▪️ Click the "10-K" from March 23rd
▪️ Scroll to "Statement of earnings"
The income statement flows in a step-down manner.
The top number is revenue (sales), and costs + expenses are subtracted as you go down
The top number is revenue (sales), and costs + expenses are subtracted as you go down
Let's take them one at a time
1: Revenue
This is the net amount received from the sales of products/services to customers
Sales are NET, meaning it includes discounts, returns, and any other deductions.
1: Revenue
This is the net amount received from the sales of products/services to customers
Sales are NET, meaning it includes discounts, returns, and any other deductions.

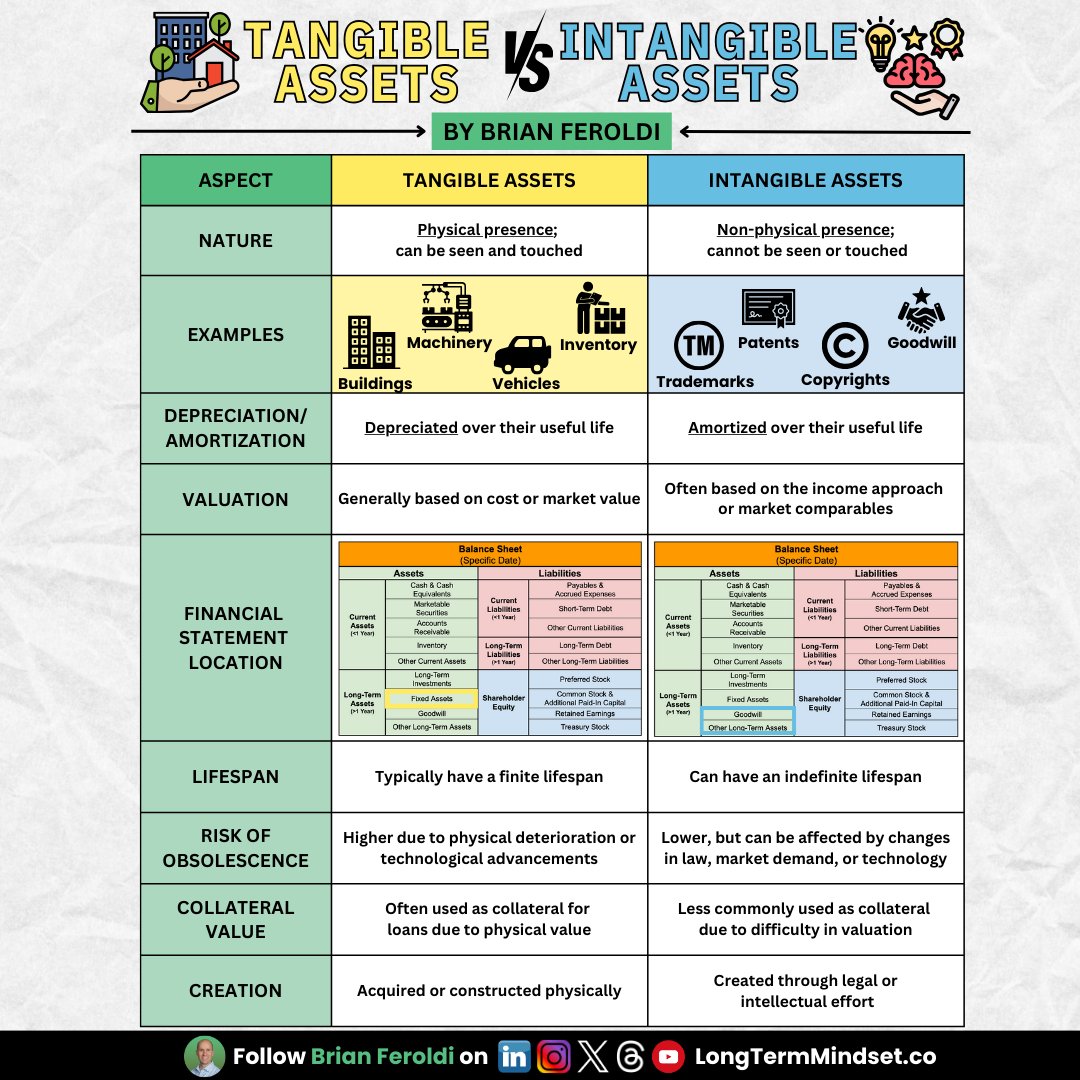
2: Cost of Goods Sold (COGS)
This figure shows all of the costs related to producing the product and/or service
It's also called "cost of sales"
This figure shows all of the costs related to producing the product and/or service
It's also called "cost of sales"

3: Gross profit
Also called “gross income”
This assesses a company's efficiency at using its labor and supplies in producing goods or services
This is a VERY important number
Also called “gross income”
This assesses a company's efficiency at using its labor and supplies in producing goods or services
This is a VERY important number

4: Operating Expenses (OPEX)
A catchall category that includes all expenses to run a company’s day-to-day operations
Some companies break them out by category. Others lump them all together.
A catchall category that includes all expenses to run a company’s day-to-day operations
Some companies break them out by category. Others lump them all together.

5: Operating Income
Gross Profit - OPEX
This shows how much profit a company earned from its ongoing operations
It can also be called “EBIT”
Gross Profit - OPEX
This shows how much profit a company earned from its ongoing operations
It can also be called “EBIT”

6: Non-Operating Income/Expense
Revenue or expenses incurred unrelated to running the business
The biggest number is usually interest on debt or gain/loss on the sale of an asset
Revenue or expenses incurred unrelated to running the business
The biggest number is usually interest on debt or gain/loss on the sale of an asset

7: Pre-tax income
Operating Income
+/-
Non-Operating Income/Expenses
Also called “EBT” or “Earnings Before Tax”
Operating Income
+/-
Non-Operating Income/Expenses
Also called “EBT” or “Earnings Before Tax”

8: Income Tax Expense
Taxes paid to federal, state, and local governments
Taxes paid to federal, state, and local governments

9: Net income
We made it to “the bottom line”, aka “earnings” or “profits”
If this number is positive, the business is "profitable"
If it's negative, the business is "unprofitable"
We made it to “the bottom line”, aka “earnings” or “profits”
If this number is positive, the business is "profitable"
If it's negative, the business is "unprofitable"

10a: Time to divide the profits!
There are 2 ways to report "earnings per share"
1) Divide by "basic shares," which is the total number of shares of common stock currently outstanding
There are 2 ways to report "earnings per share"
1) Divide by "basic shares," which is the total number of shares of common stock currently outstanding

10a:
2) Divide by "diluted" shares, which is the total number of shares that could be outstanding including stock-based compensation + convertible debt
2) Divide by "diluted" shares, which is the total number of shares that could be outstanding including stock-based compensation + convertible debt

A helpful exercise is to divide each figure by sales, giving us "margins"
Doing so allows you to compare companies of different sizes to each other and track profit direction
My favorites:
▪️Gross Margin
▪️Operating Margin
▪️Net Margin
Doing so allows you to compare companies of different sizes to each other and track profit direction
My favorites:
▪️Gross Margin
▪️Operating Margin
▪️Net Margin

If you invest, it's CRITICAL to learn accounting
Want help? @Brian_Stoffel_ and I created a course that teaches accounting in plain English
Registration is currently open
Interested? DM me for a special coupon code
maven.com/brian-feroldi/…
Want help? @Brian_Stoffel_ and I created a course that teaches accounting in plain English
Registration is currently open
Interested? DM me for a special coupon code
maven.com/brian-feroldi/…
Prefer to learn by reading books?
These three are excellent:
These three are excellent:

Want to learn more about the nuances of accounting?
This other thread I wrote can help:
This other thread I wrote can help:
https://twitter.com/BrianFeroldi/status/1534892551383261184?s=20&t=wS5Xr7M3E-J_3TtfXntakg
• • •
Missing some Tweet in this thread? You can try to
force a refresh