
Our latest estimates of excess deaths are out, covering all cause mortality to the end of May 2022, plus COVID-19 only mortality for Jun-Aug.
#COVID19Aus #excessdeaths
TLDR: +8,500 excess deaths in 5 months to May (12%)
actuaries.digital/2022/08/31/cov…
#COVID19Aus #excessdeaths
TLDR: +8,500 excess deaths in 5 months to May (12%)
actuaries.digital/2022/08/31/cov…
Note our excess deaths are measured relative to pre-pandemic expectations of mortality.
Includes allowance for continuation of mortality improvement/decline for each cause of death.
Allows for changes in the size and age composition of the population.
Includes allowance for continuation of mortality improvement/decline for each cause of death.
Allows for changes in the size and age composition of the population.
Another month of huge excess deaths in May. Only one week in 2022 to date has been within our 95% confidence interval 

A small change in our analysis this time around - we've separately estimated coroner-certified COVID deaths. We've assumed coroner-referred COVID deaths in 2022 will be 5% of all COVID deaths.

This is a bit of an heroic assumption, but we thought it important to try to show total deaths from COVID, not just doctor-certified ones.
If it's wildly wrong, it doesnt change total excess deaths. It just changes the mix between coroner-ref COVID and other coroner-ref deaths.
If it's wildly wrong, it doesnt change total excess deaths. It just changes the mix between coroner-ref COVID and other coroner-ref deaths.
Total excess deaths in May of 1,800 (12%). Half due to COVID-19. Substantial flu deaths for the first time in 2 years. Cancer up a little, but its one outlier week, not a trend. Heart disease and "other" up a lot.

In the five months to May, total excess of 8,500 deaths. Half due to COVID-19 (77 from long Covid). Respiratory down. Cancer as expected. Everything else up.

In the first 5 months of 2022, there were 1,000 deaths in people who were COVID-positive at the time of death but where COVID was not the underlying cause. So acute COVID likely contributed to the death in about a quarter of the "non-COVID" excess.
Here's the weekly deaths from COVID (doctor-certified only). About 200 per week in May.
For context, in Australia we have about 1,200 deaths from motor vehicle accidents PER YEAR.
For context, in Australia we have about 1,200 deaths from motor vehicle accidents PER YEAR.

Here's weekly respiratory deaths (flu, pneumonia, chronic lower, other - not COVID). Deaths from this cause mostly lower than predicted, and similar to 2020-21.
Will be interesting to see the June data as this is where the usual "winter hump" starts to take off.
Will be interesting to see the June data as this is where the usual "winter hump" starts to take off.

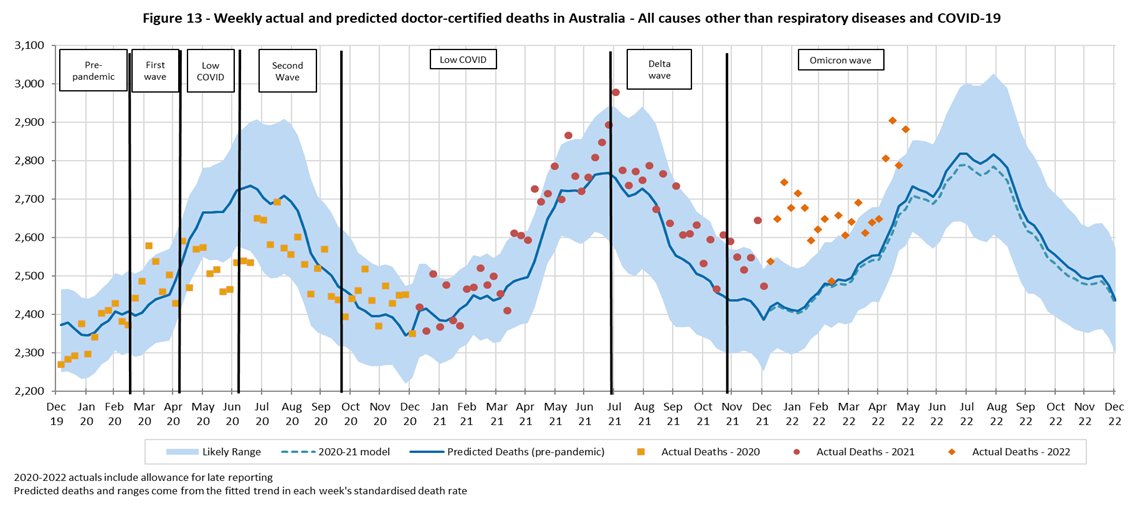
Here's all non-Covid, non-respiratory.
Bloody hell.
Bloody hell.
Graphs for each of the individual sub-causes reported on by the ABS are included at the end of the blog article.
actuaries.digital/2022/08/31/cov…
actuaries.digital/2022/08/31/cov…
For completeness, here are the figures for 2020 and 2021.

Why is our 12% for the first 5 months of 2022 different from the ABS 17%?
The ABS baseline (being the average of 2017-19 + 2021) is too low.
[This graph also highlights the big jump in deaths in 2022.]
The ABS baseline (being the average of 2017-19 + 2021) is too low.
[This graph also highlights the big jump in deaths in 2022.]

Does it matter?
At the overall level, probably not, as the message is the same - we have significant excess mortality over and above that due to COVID.
But it is important when we want to look at WHY that excess mortality is arising. So "getting it right" does matter.
At the overall level, probably not, as the message is the same - we have significant excess mortality over and above that due to COVID.
But it is important when we want to look at WHY that excess mortality is arising. So "getting it right" does matter.
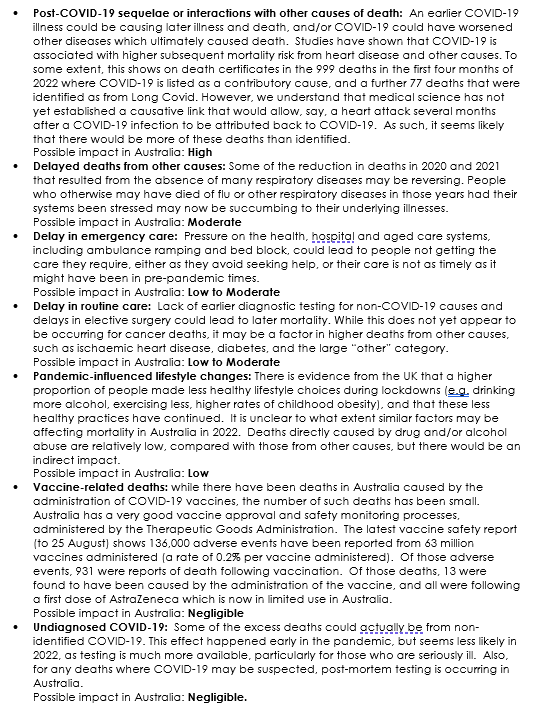
What could be causing the non-COVID excess?
I've added vaccine-related deaths to this list since last time, and also and indicator of possible the level of impact of each reason.
I've added vaccine-related deaths to this list since last time, and also and indicator of possible the level of impact of each reason.
What about beyond May?
In the last three months there have been about 5,480 surveillance COVID deaths (including an estimate for the last 3 days of Aug).
In the last three months there have been about 5,480 surveillance COVID deaths (including an estimate for the last 3 days of Aug).

Of these, we expect 76% to be "from" rather than "with" COVID, resulting in a estimated 4,200 deaths from COVID-19 in the last 3 months. Equivalent to 9% excess, before we include any excess from other causes.

Estimated excess deaths across the pandemic are 11,400 (2.5%).
Some might argue 2.5% is low. Yes, it is compared with many, many other countries.
But it is important to address when we have had 4-8% excess mortality from deaths NOT due to COVID each month so far of 2022.
Some might argue 2.5% is low. Yes, it is compared with many, many other countries.
But it is important to address when we have had 4-8% excess mortality from deaths NOT due to COVID each month so far of 2022.

The end. Any questions?
• • •
Missing some Tweet in this thread? You can try to
force a refresh


