Price changes perception.
Your view of the price level on a Friday and your view of the same price at the same level on a Monday may be 2 different things.
Prices force you to think differently.
Your view of the price level on a Friday and your view of the same price at the same level on a Monday may be 2 different things.
Prices force you to think differently.
In the markets,
Situations change.
Things happen.
Sentiment moves
Prices react.
Let me repeat - Prices REACT
The degree of reaction changes and forces traders who were previously bullish to now go bearish or vice versa
Have you seen this before?
Situations change.
Things happen.
Sentiment moves
Prices react.
Let me repeat - Prices REACT
The degree of reaction changes and forces traders who were previously bullish to now go bearish or vice versa
Have you seen this before?
As reactions/ responses flow in, price starts moving abruptly
Then inventory has to adjust.
Inventory is defined as an existing position of the market participant
I could be cash market inventory as in stocks, or could be derivatives as in futures or options.
Then inventory has to adjust.
Inventory is defined as an existing position of the market participant
I could be cash market inventory as in stocks, or could be derivatives as in futures or options.
The cash ( stock) players are long termers and mostly unmoved by short term change
It's the derivative players who make things spicy
Reason- They are leveraged and a 2% move can mean derivative positions going up or down 20% or even more.
It's the derivative players who make things spicy
Reason- They are leveraged and a 2% move can mean derivative positions going up or down 20% or even more.
The derivative to cash ratio is a useful metric to track the amount of leverage in the system.
The NSE uploads this data every evening
Here is the once from yesterday
The NSE uploads this data every evening
Here is the once from yesterday
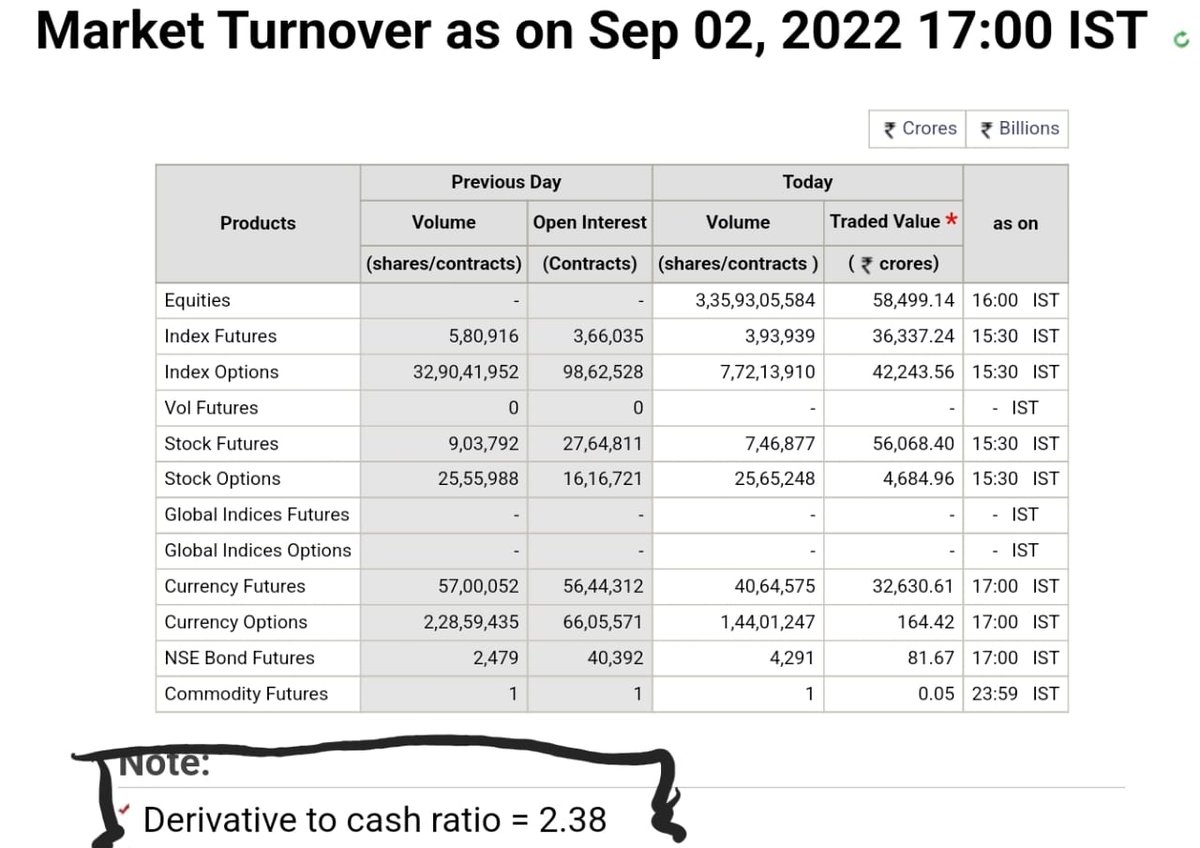
On a wed and a Thus especially, that ratio jumps to 4: 1. Now we have 4 X times derivatives volume than cash volume.
A classic tail wagging the dog scenario
And Thursday settlement afternoons, the markets move more than the usual as inventory adjusts
A classic tail wagging the dog scenario
And Thursday settlement afternoons, the markets move more than the usual as inventory adjusts
Since prices motivate inventory action, understanding inventory of participants becomes very important
Most people use Open Interest to track inventory
We use Orderflow @Vtrender
Does not matter what you use as long as you know how to read this important piece of data
Most people use Open Interest to track inventory
We use Orderflow @Vtrender
Does not matter what you use as long as you know how to read this important piece of data
The greatest damage to existing portfolios happens in the smallest timeframe which is one hour to one week
One week is a lifetime for a derivatives trader & a typical flow of money through A WEEK which starts Friday & ends Thursday is between 1000 - 1500 CR some weeks even more
One week is a lifetime for a derivatives trader & a typical flow of money through A WEEK which starts Friday & ends Thursday is between 1000 - 1500 CR some weeks even more
Incidentally the derivative picture paints larger volumes for the weekly cycle over the monthly cycle with crores changing hands daily.
A quick look at holdings for a week ( thurs settlement) can help in understanding which traders are profitable or which traders are to use a term from #Orderflow "upside down"
It's the " upside down" traders who create the moves in prices as they have to adjust their "inventory"
Contrary to what people think, it is not new business but existing business or old inventory which moves markets
Contrary to what people think, it is not new business but existing business or old inventory which moves markets
Popular terms to describe this movement of old business or old inventory is called " short covering" or "long liquidation"
Now you know why it happens
Now you know why it happens
A typical thurs in the markets has between 22 to 33 CR of contracts ( number of contracts ) traded with out fail.
An average day between Fri to wed is typically 6 CR contracts
An average day between Fri to wed is typically 6 CR contracts
In #MarketProfile we change our focus from the study of price to the movement of Volume .
Larger volumes inevitably mean larger change in prices which fuel more inventory adjustments creating even bigger volume.
The cycle moves.
Larger volumes inevitably mean larger change in prices which fuel more inventory adjustments creating even bigger volume.
The cycle moves.
Price behavior now becomes a by product of this inventory change
Hopefully the thread has helped you with undertand market behavior a bit more.
I am passionate about trading markets and like to tweet often on what I see
You can catch some of my old threads at
I am passionate about trading markets and like to tweet often on what I see
You can catch some of my old threads at
https://twitter.com/Am_Shai/status/1535858817690243072?s=20&t=2XiLUgLapY1y3YOt5XROoQ
• • •
Missing some Tweet in this thread? You can try to
force a refresh