Karen Cutter Profile picture
Sep 8, 2022 12 tweets 4 min read Read on X
One of the common questions people have asked me about our excess deaths work is "have you looked at it by age?"
Here's a bit of insight into that question, noting it comes with a lot of caveats...
#covid19Aus #excessdeaths
For anyone who missed it, here is my thread of excess deaths in Australia to the end of May 2022
First off, the ABS provisional mortality statistics show a breakdown by age/gender. But the age groups are very broad (0-44, 45-64, 65-74, 75-84, 85+). So there could be trends occurring within the age bands that are hidden when grouped together.
Eg, its not unreasonable to expect that mortality for 45-50yrs was less impacted by the pandemic than 60-64yrs, but they are in the one age band.
Even combining 65-69 with 70-74 might mask a bigger change in the older half cf the younger half.
And the 0-44 age band is very big!
There is also no breakdown by age/gender x cause. Cause is really helpful as it can help explain why we might be seeing a certain trend. We know mortality in 2020 and 2021 was impacted by lower respiratory deaths, but can only guess the impacts of this by age.
This graph shows the Aust population from 2015-2022 in the 5 age bands.
[Aside: the lack of migration in 2020 and 2021 shows clearly here in the under 65s] Image
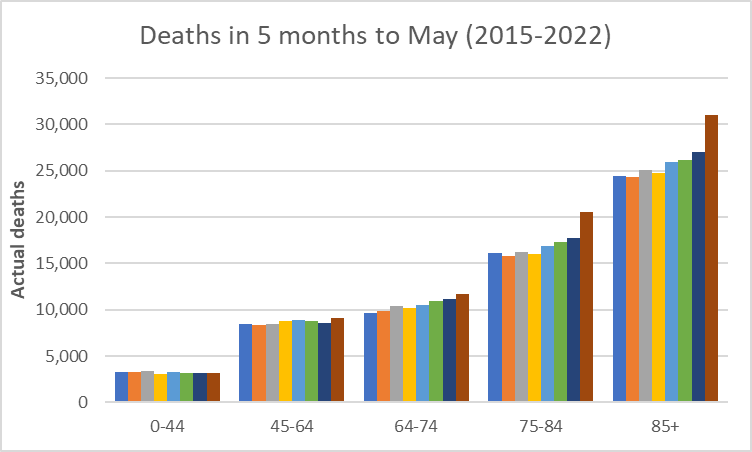
Contrast the population graph with this one showing deaths in the first five months of each year from 2015-2022. The 0-44s make up 60% of pop but only 5% of deaths, while 85+ make up only 2% of pop but 40% of deaths. Image
The graph clearly shows a big increase in numbers of deaths in the 75-84 and 85+ age groups in 2022, more so that population increases would suggest.
The 45-64 and 64-75 age groups are less clear. While deaths are up a little, numbers are small and may be driven by pop changes. Image
A VERY rough back of the envelope calculation suggests excess mortality in 2022 by age group of:
- around 15% for both 75-84 and 85+
- ballpark of around 5% for 65-74
- less than 5% for under 64
And the excess for males maybe a few % points worse than for females.
Does this help with identifying what might be causing excess deaths?
For me, it is yet more evidence that vaccines are not a driver. Given that all age groups other than children are very highly vaccinated, we would have seen more deaths in younger cohorts.
It also supports that drugs/alcohol/diet are unlikely to be a big contributor as they are more likely to show up in younger age cohorts.
But I think everything else is still on the table in terms of our four most likely reasons. Image
The end. Any questions?
[And before you ask, yes, I am planning to do a look by state/territory.]

• • •

Missing some Tweet in this thread? You can try to force a refresh
 

Keep Current with Karen Cutter

Karen Cutter Profile picture

Stay in touch and get notified when new unrolls are available from this author!

Read all threads

This Thread may be Removed Anytime!

PDF

Twitter may remove this content at anytime! Save it as PDF for later use!

Try unrolling a thread yourself!

how to unroll video
  1. Follow @ThreadReaderApp to mention us!

  2. From a Twitter thread mention us with a keyword "unroll"
@threadreaderapp unroll

Practice here first or read more on our help page!

More from @KarenCutter4

Apr 12
Some fact checking on this article.
TLDR: Australia has not reached a 'significant' COVID milestone
A short thread/
"Australia appears to have had at least a week where no COVID-associated deaths were recorded for the first time in more than two years."
This is simply not true. The statement is based on this Fed Health graph. Image
Yes, it does show a 7-day average of zero deaths for the most recent data points. But this ignores the fact that the graph is compiled using date of death, and it is almost impossible for someone to die, have their death registered, and included in the Fed data within a week! Image
Read 11 tweets
Apr 5
The Mortality Working Group of the Actuaries Institute has released our estimate of excess mortality for the full year 2023.
TLDR: Excess mortality for 2023 is 5% (95% CI: 3%-7%) or +8,400 deaths.
A thread/
actuaries.digital/2024/04/05/exc…
Note that our expected number of deaths (baseline) is our expectation had the pandemic not happened.
The baseline allows for changes in the age and size composition of the population over time, plus allows for pre-pandemic mortality trend to continue.
We finished the year with deaths being much higher than expected for each of the four weeks in December (as they were in November). Image
Read 15 tweets
Mar 27
Australian deaths counts: surveillance vs death certificates.
For some time now I have been quizzically looking at the death surveillance reporting, thinking the numbers looked too low.
A thread/
This is because of the relationship between hospitalisations and deaths.
Normally deaths track hospital admissions quite closely, but with a little bit of a lag. But for Dec23 and Jan24, this relationship changed - deaths are lower than expected based on hospitalisations. Image
A few theories were floating around about why (eg. JN.1 less severe), but it also didnt make sense to me from looking at the Vic death reporting, and knowing the Vic wave was a bit earlier than the rest of Aust. Things just werent stacking up nicely.
Read 8 tweets
Mar 1
The Mortality Working Group* of the Actuaries Institute has estimated Australian excess mortality to 30 November 2023.

A thread/

* re-branded as we plan to look at more than just Covid
Total excess mortality for the first 11 months of 2023 is estimated at 5% (95% confidence interval: 3% to 7%).
This is about 7,400 more deaths than expected if the pandemic had not happened.
This compares to excess mortality for 2022 of 11%.
With only one month of data still to be reported for 2023, we expect that excess mortality for the full year 2023 will be about half the level of 2022.
Read 11 tweets
Feb 21
The ONS has released a new methodology for calculating excess deaths.
A thread/
First off, I am going to say that this is NOT a conspiracy to hide excess deaths.
This is a government institution doing its best to estimate excess deaths in a sensible way, noting where we are in the pandemic.
Now that we are going into the fifth year post-pandemic, those of us measuring excess mortality are needing to make hard decisions on how to do it.
We are in a difficult phase (measurement wise) as we cant reliably estimate a pre-pandemic baseline (pre-pandemic was ...
Read 13 tweets
Jan 17
Last week the OECD published this paper on recent mortality trends, including yet another estimate of excess mortality.
How do the OECD results for Australia differ to the Actuaries working group results?
A thread/
oecd-ilibrary.org/docserver/78f6…
I'm going to start by saying there is no "right" answer to how to measure excess mortality.
By definition, excess mortality is the difference between actual deaths that occurred in a period, and a predicted number of deaths. And the predicted number is just that - a prediction
Depending on what you are doing, there may be valid reasons for choosing one particular prediction method over another.
In the case of the OECD, they are trying to form estimates for all OECD countries, and so choice of method can become very restricted. This is because...
Read 16 tweets

Did Thread Reader help you today?

Support us! We are indie developers!


This site is made by just two indie developers on a laptop doing marketing, support and development! Read more about the story.

Become a Premium Member ($3/month or $30/year) and get exclusive features!

Become Premium

Don't want to be a Premium member but still want to support us?

Make a small donation by buying us coffee ($5) or help with server cost ($10)

Donate via Paypal

Or Donate anonymously using crypto!

Ethereum

0xfe58350B80634f60Fa6Dc149a72b4DFbc17D341E copy

Bitcoin

3ATGMxNzCUFzxpMCHL5sWSt4DVtS8UqXpi copy

Thank you for your support!

Follow Us!

:(