You don't need to pay someone ₹50,000 or even ₹25,000 to know CPR Indicator.
This thread will show you how...for Free.
Here's My 16-Points For Using CPR Indicator Into A Profitable System in Intraday Trading:
Thread 🧵
This thread will show you how...for Free.
Here's My 16-Points For Using CPR Indicator Into A Profitable System in Intraday Trading:
Thread 🧵

The Central Pivot Range (CPR) indicator is a technical analysis tool that is used by traders to help identify potential trading opportunities
The CPR indicator is based on the concept of support & resistance levels. It can be used to help identify potential entries/exits
(1/N)
The CPR indicator is based on the concept of support & resistance levels. It can be used to help identify potential entries/exits
(1/N)
CPR is developed by Frank Ochoa. It is similar to Pivot Points but with additional lines (TC & BC).
As per Frank,
CPR is the Swiss Army Knife of pivots, and Like the Moon, the central pivot range controls the tides of the market.
(2/N)
As per Frank,
CPR is the Swiss Army Knife of pivots, and Like the Moon, the central pivot range controls the tides of the market.
(2/N)

Pivot Points Formula
Pivot point (PP) = (High + Low + Close) / 3
R1 = (2 x PP) – Low
S1 = (2 x PP) – High
R2 = PP + (High – Low)
S2 = PP – (High – Low)
(3/N)
Pivot point (PP) = (High + Low + Close) / 3
R1 = (2 x PP) – Low
S1 = (2 x PP) – High
R2 = PP + (High – Low)
S2 = PP – (High – Low)
(3/N)
CPR Indicator Formula
The CPR Indicator consists of 3 components:
Pivot = (High + Low + Close)/3
BC = (High + Low)/ 2
TC = (Pivot – BC) + Pivot
(4/N)
The CPR Indicator consists of 3 components:
Pivot = (High + Low + Close)/3
BC = (High + Low)/ 2
TC = (Pivot – BC) + Pivot
(4/N)

Instead of using the Pivot Points indicator, use CPR Indicator with R1, R2, and S1, S2 levels.
This setup gives more comfort to intraday traders.
In Tradingview, search for "Mnj-CPR" and enable these levels in settings as shown in the image.
(5/N)
This setup gives more comfort to intraday traders.
In Tradingview, search for "Mnj-CPR" and enable these levels in settings as shown in the image.
(5/N)

In addition, set the visibility of these lines to 'circles' so they appear smooth.
By default, it will have a 'line' and it doesn't look smooth.
(6/N)
By default, it will have a 'line' and it doesn't look smooth.
(6/N)

The beauty of this indicator is its values remain the same even if you change the timeframe (as it is calculated from the previous day range)
It immensely helps day traders!
Check the Nifty chart on 5-Sep-2022 in 5-min & 15-min timeframe, and CPR values are the same.
(7/N)
It immensely helps day traders!
Check the Nifty chart on 5-Sep-2022 in 5-min & 15-min timeframe, and CPR values are the same.
(7/N)

If the price opens and sustains above CPR range in the open action for 5-15 minutes, then we can retain the 'Bullish' view.
(8/N)
(8/N)

If the price opens and sustains below CPR range in the open action for 5-15 minutes, then we can retain the 'Bearish' view.
(9/N)
(9/N)

If the price opens and sustains within CPR range in the open action for 5-15 minutes, then we can retain the 'Sideways' view.
Hint: Short Straddle traders can take more risk 😂
(10/N)
Hint: Short Straddle traders can take more risk 😂
(10/N)

Market displays this behavior (open above, below, and at CPR) with high probability.
It fails rarely. But all these rare failures display 'One Unique Behavior.'
If you find out this, it will take your trading to the next level.
This is your homework🤣🤣
(11/N)
It fails rarely. But all these rare failures display 'One Unique Behavior.'
If you find out this, it will take your trading to the next level.
This is your homework🤣🤣
(11/N)
Narrow CPR indicates a trending market.
Check the below Banknifty chart on 8-Sep-2022.
CPR is completely narrow, and the market trended on the upside (open above CPR confirms uptrend).
(12/N)
Check the below Banknifty chart on 8-Sep-2022.
CPR is completely narrow, and the market trended on the upside (open above CPR confirms uptrend).
(12/N)

Wide CPR indicates a range-bound market
Check the below Banknifty chart on 1-Sep-2022
CPR is completely wide, and the market displayed range-bound moves for the entire day
Hint: Straddle traders can take some more risk (in case of wide CPR + Price closes inside CPR) 😂
(12/N)
Check the below Banknifty chart on 1-Sep-2022
CPR is completely wide, and the market displayed range-bound moves for the entire day
Hint: Straddle traders can take some more risk (in case of wide CPR + Price closes inside CPR) 😂
(12/N)

Once again, the market displays this behavior (narrow & wide CPR) with high probability
It fails rarely. But all these rare failures display 'One more Unique Behavior.'
Find out this, and you will have a special edge over other traders!
This is your second homework🤣🤣
(13/N)
It fails rarely. But all these rare failures display 'One more Unique Behavior.'
Find out this, and you will have a special edge over other traders!
This is your second homework🤣🤣
(13/N)
Whenever you take a trade, carefully observe price action at R1, R2, S1, and S2.
You can use these levels as support and resistance.
(14/N)
You can use these levels as support and resistance.
(14/N)

Intraday Trading:
- Use "Daily CPR"
- Use only a 5-min or 15-min timeframe.
BTST/Swing Trading:
- Use "Weekly CPR"
- Use only a 1-Hour or 2-Hour timeframe.
(15/N)
- Use "Daily CPR"
- Use only a 5-min or 15-min timeframe.
BTST/Swing Trading:
- Use "Weekly CPR"
- Use only a 1-Hour or 2-Hour timeframe.
(15/N)
That's a wrap!
You can appreciate my work by doing these simple things:
1. Follow me
@indraziths
for more threads on the stock market trading
2. RT the tweet below to share this thread with your audience
3. Read my new book about Intraday Trading
amzn.to/3QxZtTf
You can appreciate my work by doing these simple things:
1. Follow me
@indraziths
for more threads on the stock market trading
2. RT the tweet below to share this thread with your audience
3. Read my new book about Intraday Trading
amzn.to/3QxZtTf
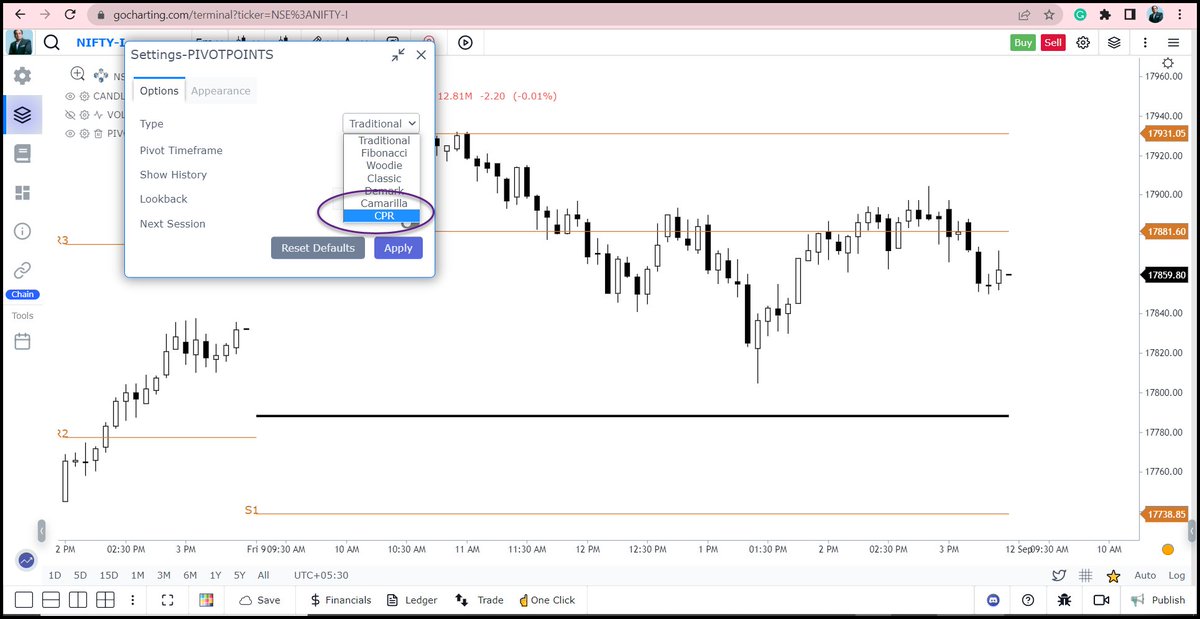
CPR is also available with the @gocharting platform
Add the 'Pivot Points' indicator, go to settings and change the type to 'CPR'
Add the 'Pivot Points' indicator, go to settings and change the type to 'CPR'

• • •
Missing some Tweet in this thread? You can try to
force a refresh


