The US Government is bankrupt.
By 2032, entitlement spending plus interest on the debt will be 100% of tax revenue!
This has massive implications for the economy...but it's not what you think.
Let's see where this is heading 👇
(Hint: It's not hyperinflation)
1/25
By 2032, entitlement spending plus interest on the debt will be 100% of tax revenue!
This has massive implications for the economy...but it's not what you think.
Let's see where this is heading 👇
(Hint: It's not hyperinflation)
1/25
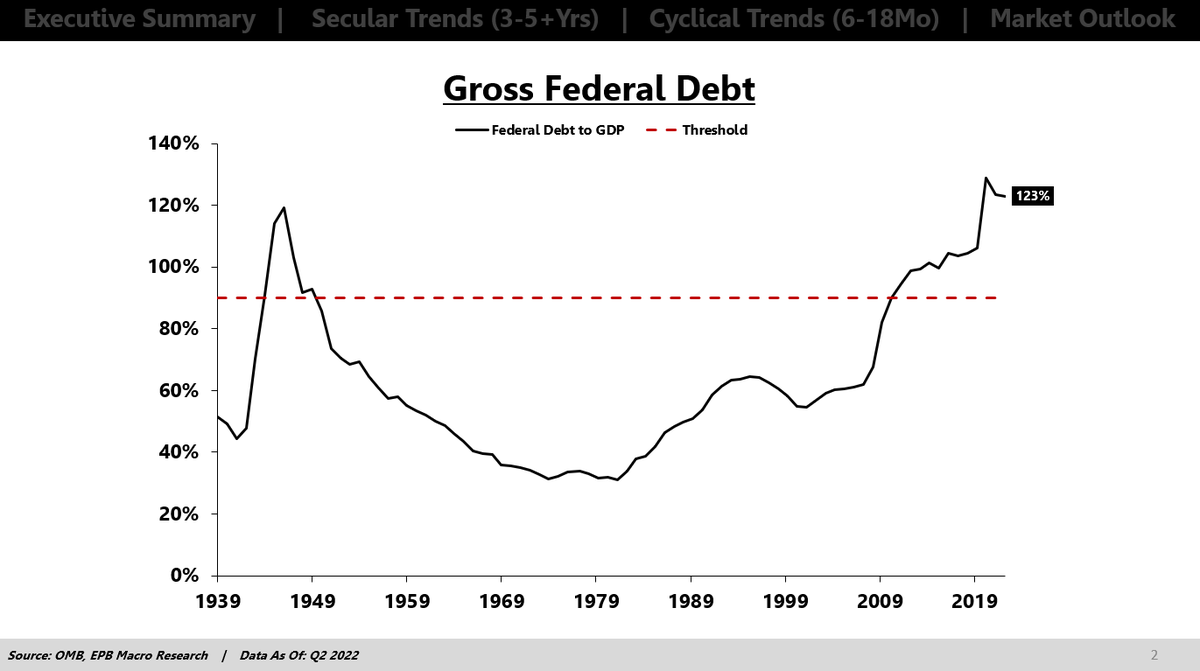
The Federal Government has about $31 trillion in debt on $25 trillion of GDP.
This ratio of ~125% debt to GDP is the highest in US history, and it's only set to get worse.
2/25
This ratio of ~125% debt to GDP is the highest in US history, and it's only set to get worse.
2/25
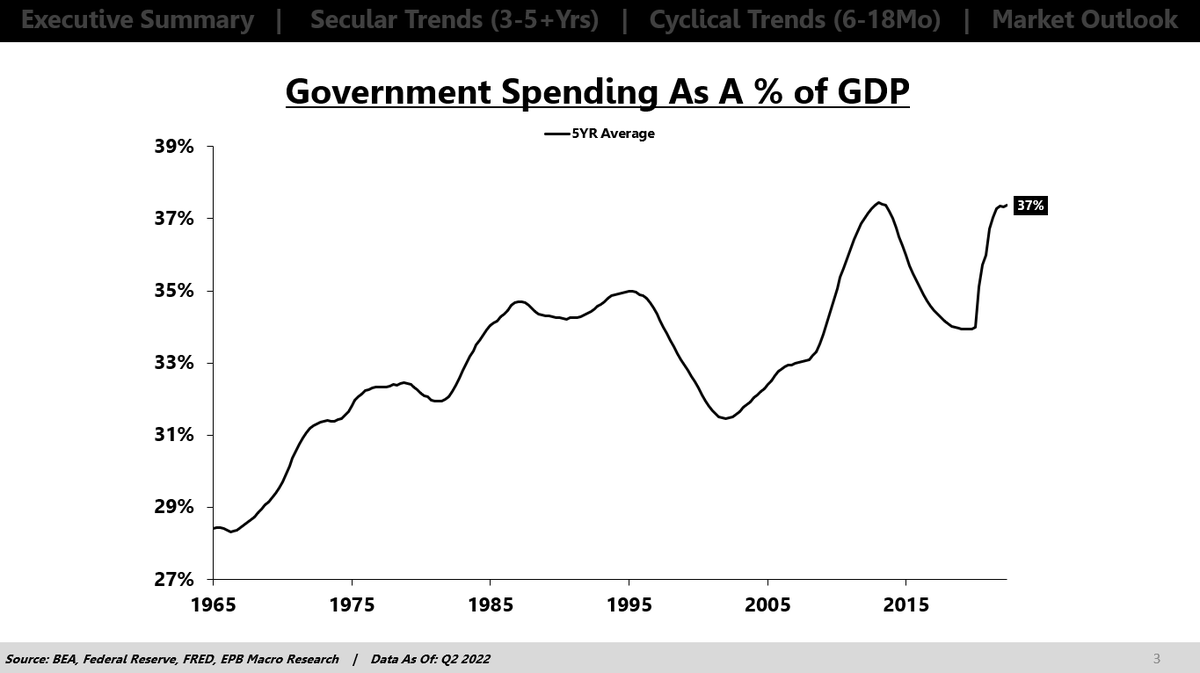
Government spending has steadily increased over the last 50 years.
In the 1960s, government spending was equal to roughly 28% of the economy.
Today, government spending is averaging 37% of GDP.
3/25
In the 1960s, government spending was equal to roughly 28% of the economy.
Today, government spending is averaging 37% of GDP.
3/25
Not only has the government been spending more, but the composition of the spending has radically changed.
In the 1960s, about 75% of spending was "discretionary," and 25% of spending was "mandatory."
Mandatory spending is basically entitlements + interest on the debt.
4/25
In the 1960s, about 75% of spending was "discretionary," and 25% of spending was "mandatory."
Mandatory spending is basically entitlements + interest on the debt.
4/25
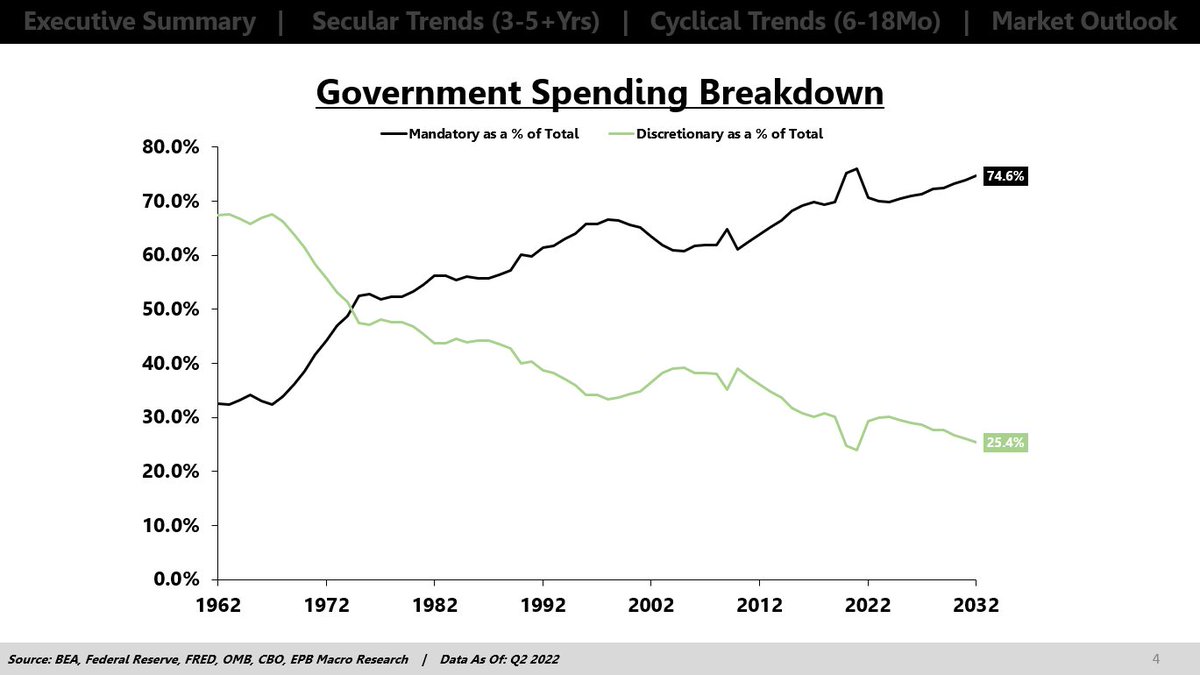
Today, the ratios have completely flipped.
Mandatory spending is 75%, and discretionary spending is 25%.
This is only set to get worse as this mandatory spending (entitlements) is going to balloon as all the baby boomers age past 65.
5/25
Mandatory spending is 75%, and discretionary spending is 25%.
This is only set to get worse as this mandatory spending (entitlements) is going to balloon as all the baby boomers age past 65.
5/25

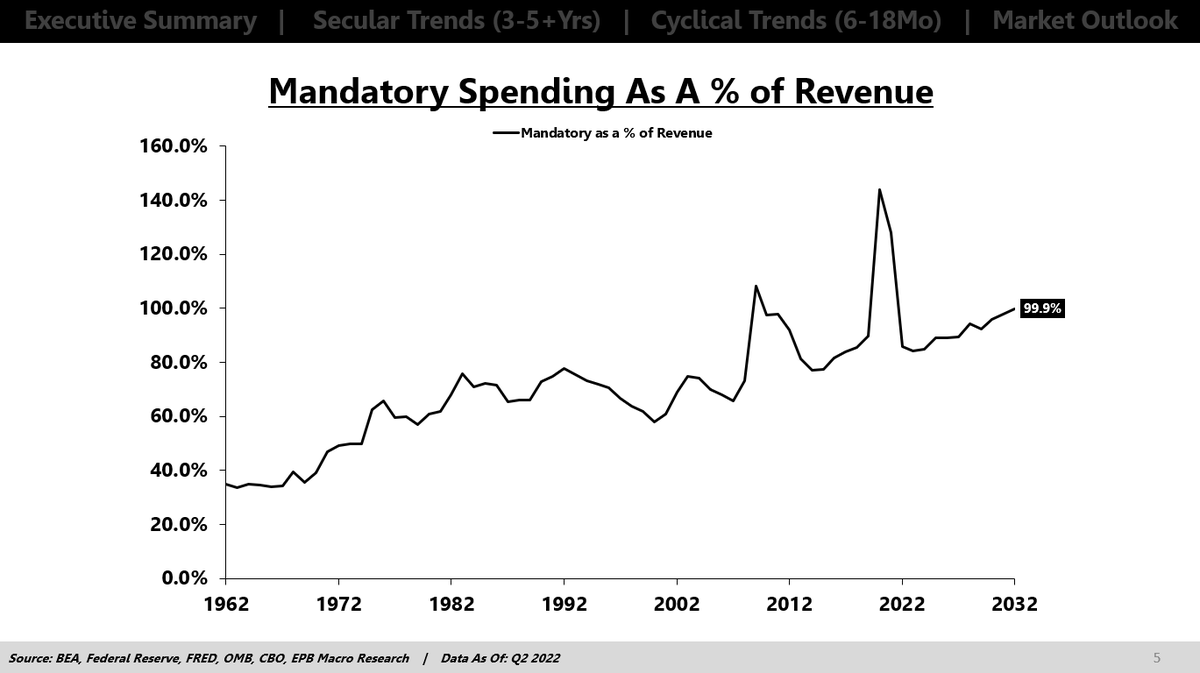
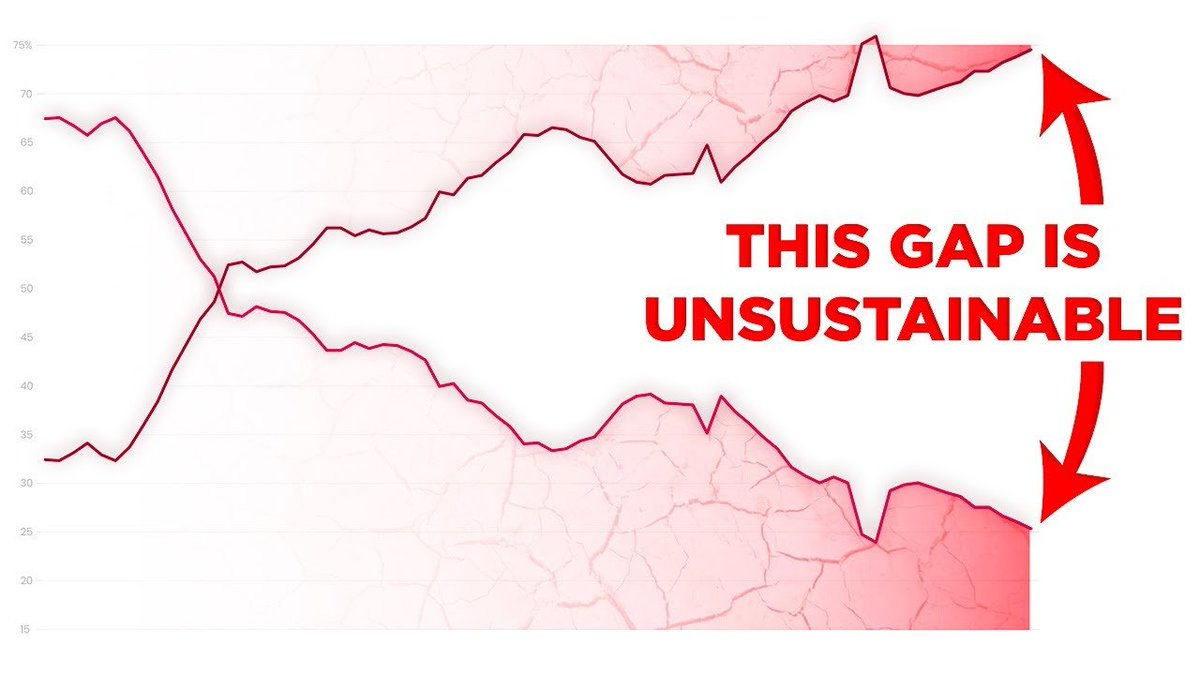
By 2032, by the government’s own projections, this mandatory government spending will be 100% of tax revenue.
6/25
6/25
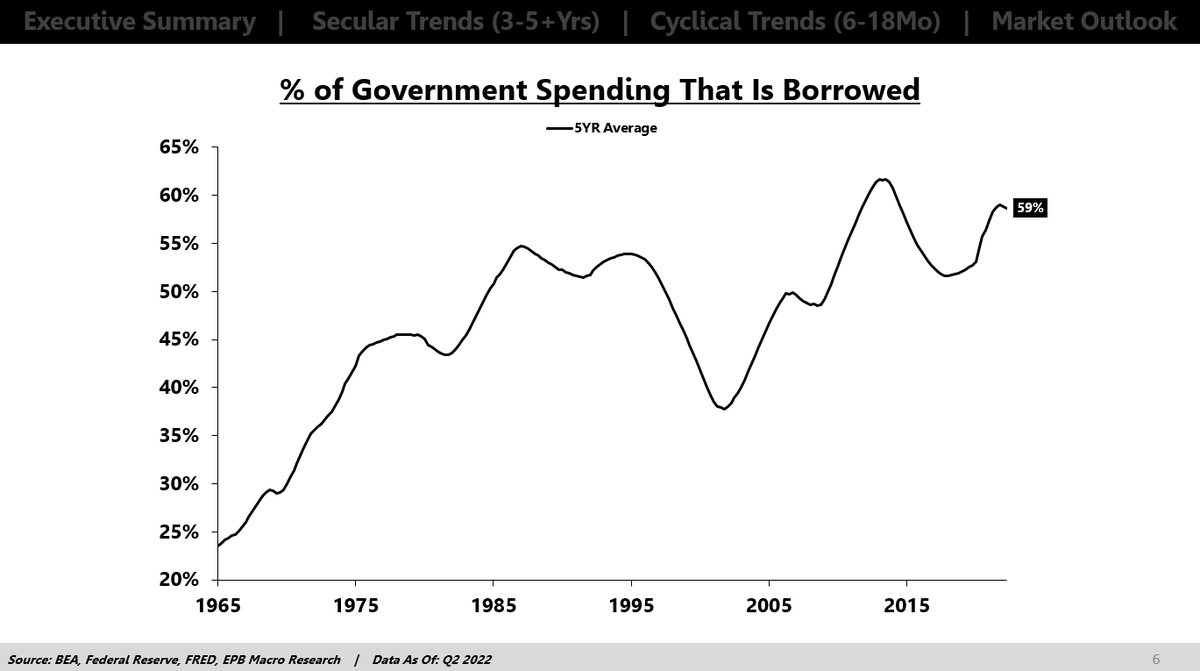
In the 1960s, about 25 cents of every dollar the government spent came from borrowing, and 75 cents was funded with taxes.
Today, 60 cents of every dollar the government spends has to be borrowed.
Due to the entitlement programs, these borrowing needs will increase.
7/25
Today, 60 cents of every dollar the government spends has to be borrowed.
Due to the entitlement programs, these borrowing needs will increase.
7/25
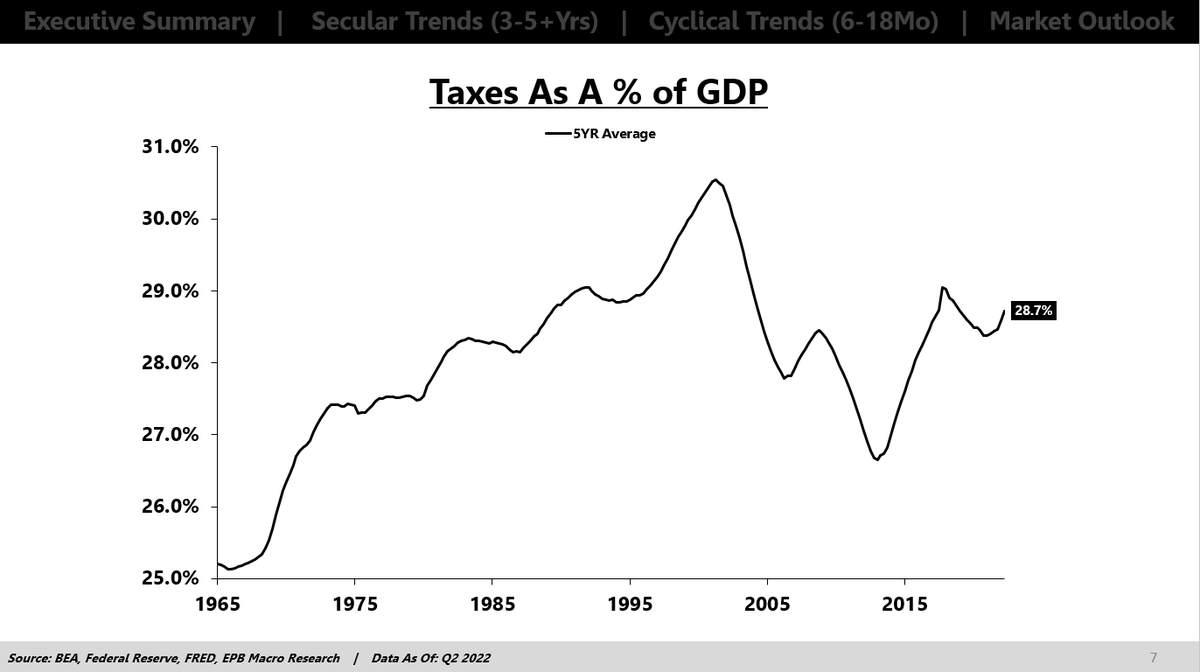
Taxes have been creeping higher, rising from about 25% of GDP to 28% of GDP but raising taxes isn't politically popular.
The path of least resistance is to simply issue more debt. So more debt is likely the way forward.
What does that mean?
8/25
The path of least resistance is to simply issue more debt. So more debt is likely the way forward.
What does that mean?
8/25
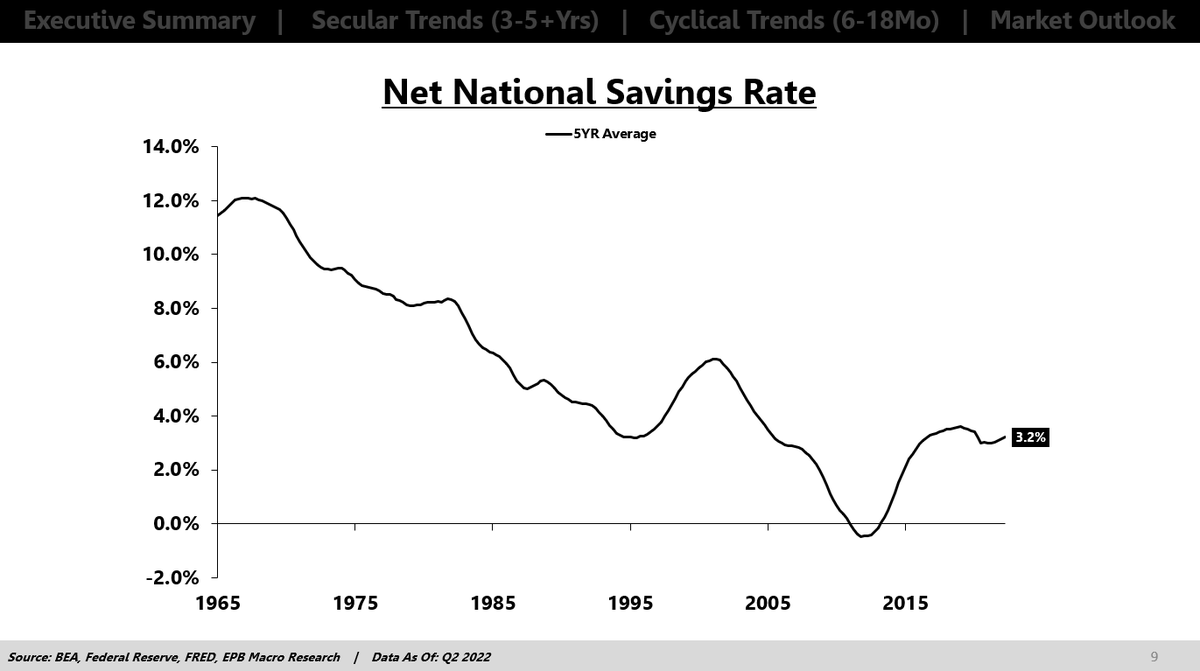
We have to look at net national savings.
Net national savings includes government savings, private savings, and foreign savings.
The combination of the savings from all these areas is net national savings.
9/25
Net national savings includes government savings, private savings, and foreign savings.
The combination of the savings from all these areas is net national savings.
9/25
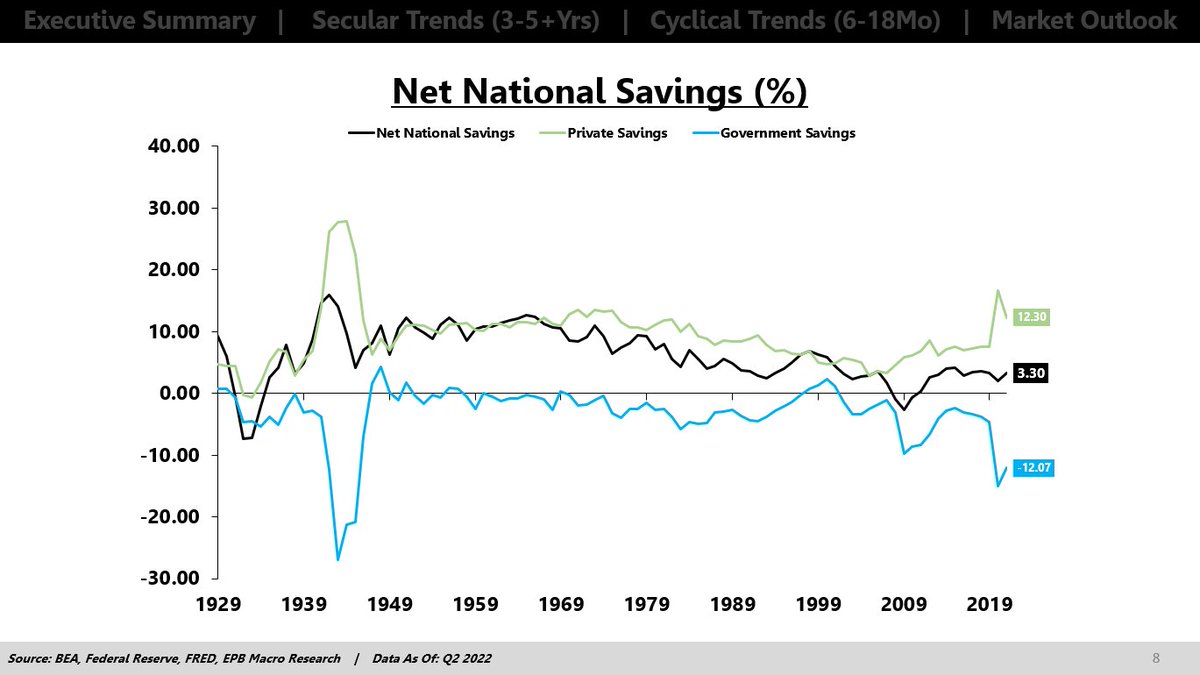
In the 1940s, the government ran large deficits (negative savings), but net national savings was very high, in the 12% range
The private sector ran massive savings (almost 30%)
The economy had a lot of savings for future investment/debt reduction in the post-war period.
10/25
The private sector ran massive savings (almost 30%)
The economy had a lot of savings for future investment/debt reduction in the post-war period.
10/25

Over the last several decades, the rate of net national savings has been in free fall, declining from 12% to just 3%.
The government is running huge deficits and the private sector simply cannot save enough to offset the government dissavings.
11/25
The government is running huge deficits and the private sector simply cannot save enough to offset the government dissavings.
11/25
We know that budget deficits will continue to grow, & this government dissavings must be met with higher private saving or a larger trade deficit
If households don't want to save more (consume less) & the trade deficit cannot grow larger, then private investment will tank
12/25
If households don't want to save more (consume less) & the trade deficit cannot grow larger, then private investment will tank
12/25
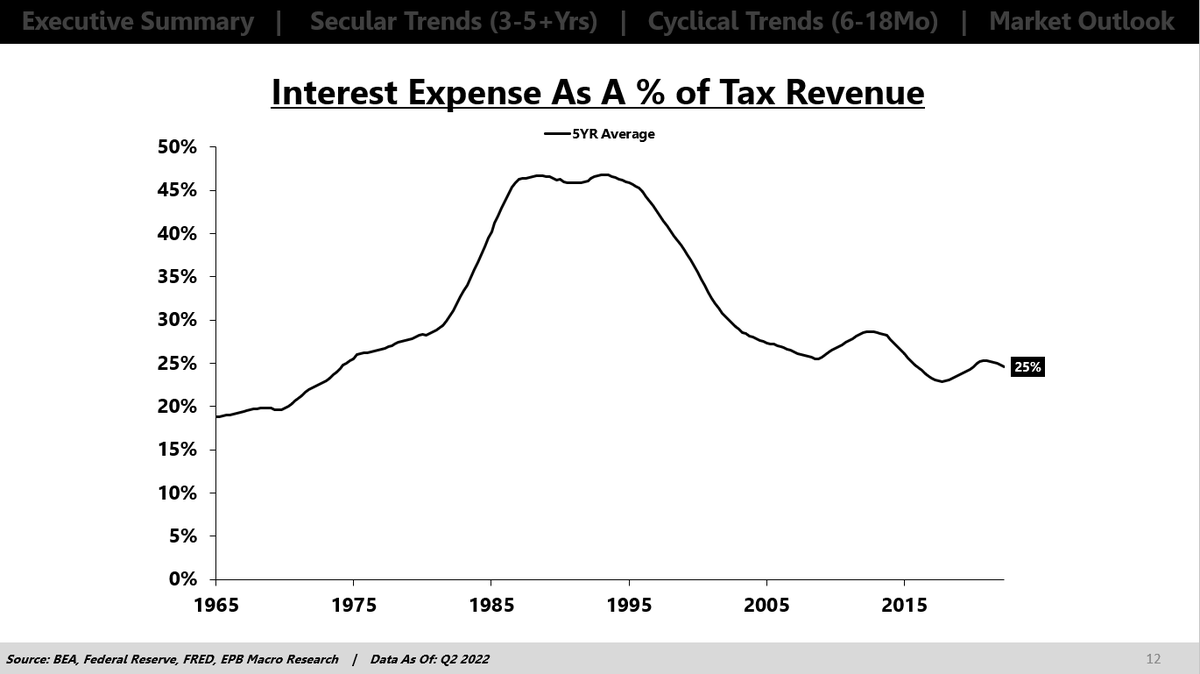
Many people believe the Fed, through QE, can be a source of economic savings.
This is not the case.
The Fed can change the nature of government liabilities from long-term to short-term, thereby reducing interest expense, but the Fed cannot be a source of savings.
13/25
This is not the case.
The Fed can change the nature of government liabilities from long-term to short-term, thereby reducing interest expense, but the Fed cannot be a source of savings.
13/25
So what’s going to happen is the net national savings rate is going to fall, & this will manifest in two ways.
First, the trade deficit will get wider (to some extent), & second, is that private sector investment will fall
Investment means physical investment, not stocks
14/25
First, the trade deficit will get wider (to some extent), & second, is that private sector investment will fall
Investment means physical investment, not stocks
14/25
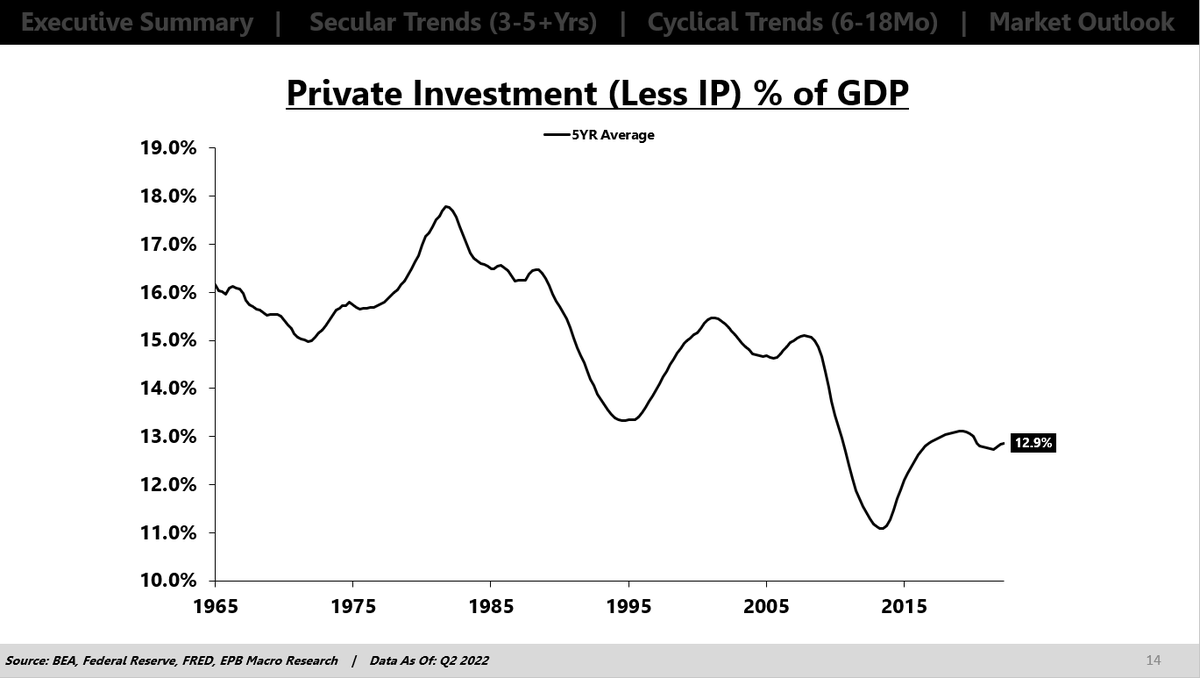
This chart shows private investment (structures, equipment & residential construction) as a share of GDP.
It has fallen from 16%-18% down to 12%.
Investment generates new sources of income and productivity, allowing the economy to make improvements in the quality of life
15/25
It has fallen from 16%-18% down to 12%.
Investment generates new sources of income and productivity, allowing the economy to make improvements in the quality of life
15/25
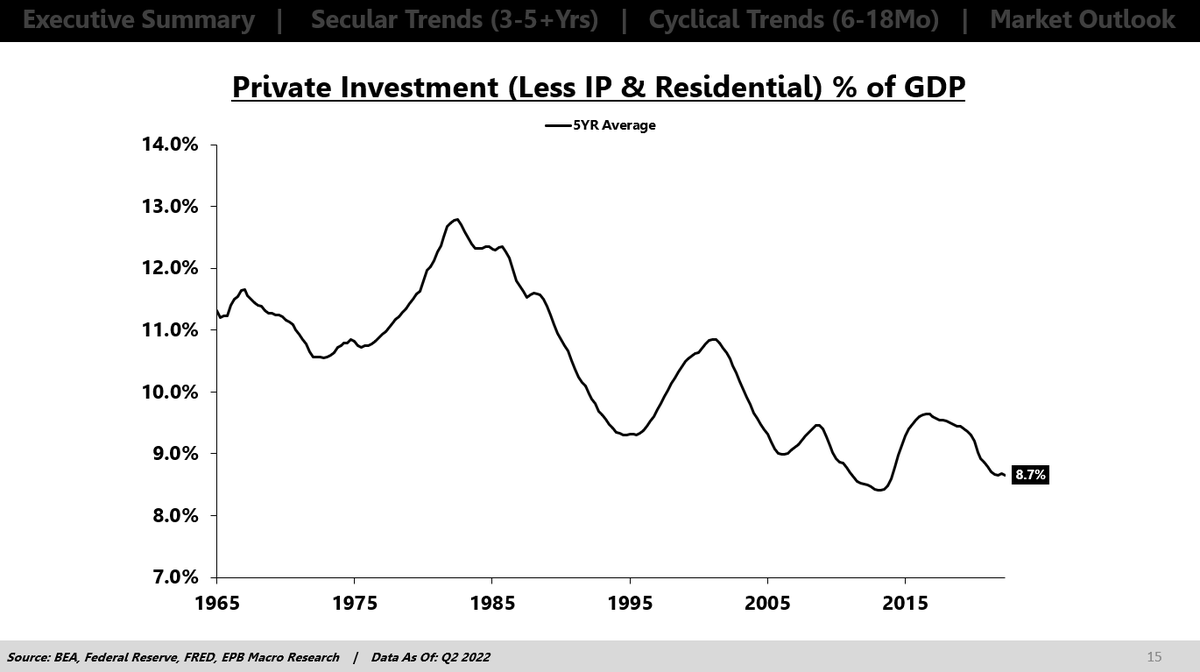
Looking at just structures & equipment, the picture is even worse.
This includes hospitals, water systems, power plants, electrical grids, industrial supplies & more.
An economy does not advance through consumption or government spending but only through investment
16/25
This includes hospitals, water systems, power plants, electrical grids, industrial supplies & more.
An economy does not advance through consumption or government spending but only through investment
16/25

Think about the stories we hear today about water systems breaking down, air transportation cancellations, and electric grids failing, and then think about the lost productivity of these events compounding year after year. It really adds up over time.
17/25
17/25
In the 1980s, we spent 12% of GDP on these areas compared to 8% today. That would be the equivalent of an extra $1T/year that we could spend on improving the efficiency of the country's infrastructure & making productivity gains if we had sufficient savings. But we don’t.
18/25
18/25
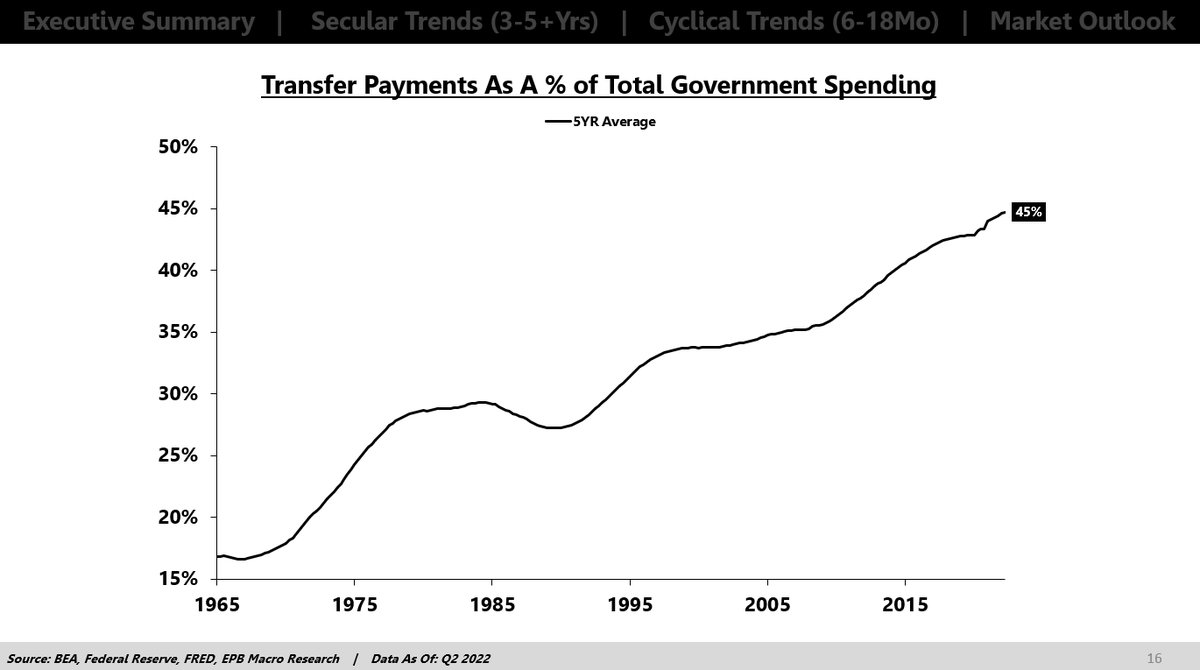
All our resources are going towards unproductive transfers.
In the 1960s, 15 cents of every dollar the government spent went towards transfer payments. Today it's nearly 50 cents.
19/25
In the 1960s, 15 cents of every dollar the government spent went towards transfer payments. Today it's nearly 50 cents.
19/25
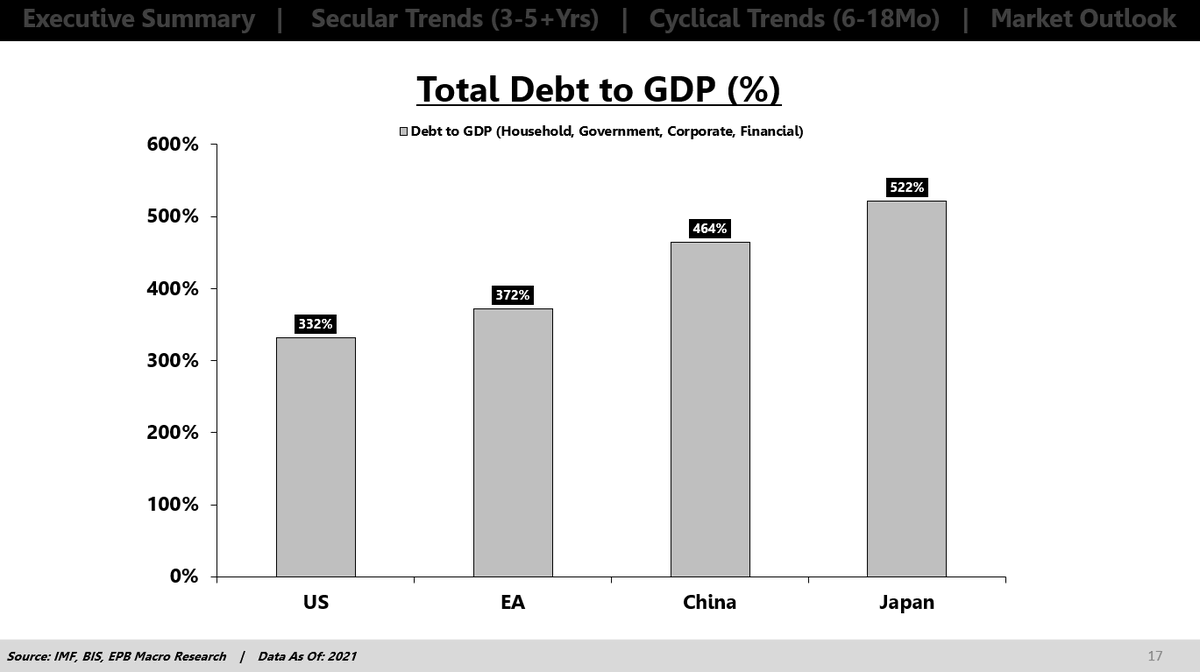
This all sounds like the USD is doomed, but we have to remember it's a relative game.
Doomed vs. what? Vs. who?
IMF data shows public & private debt in Europe, China, and Japan is much higher than in the US.
20/25
Doomed vs. what? Vs. who?
IMF data shows public & private debt in Europe, China, and Japan is much higher than in the US.
20/25
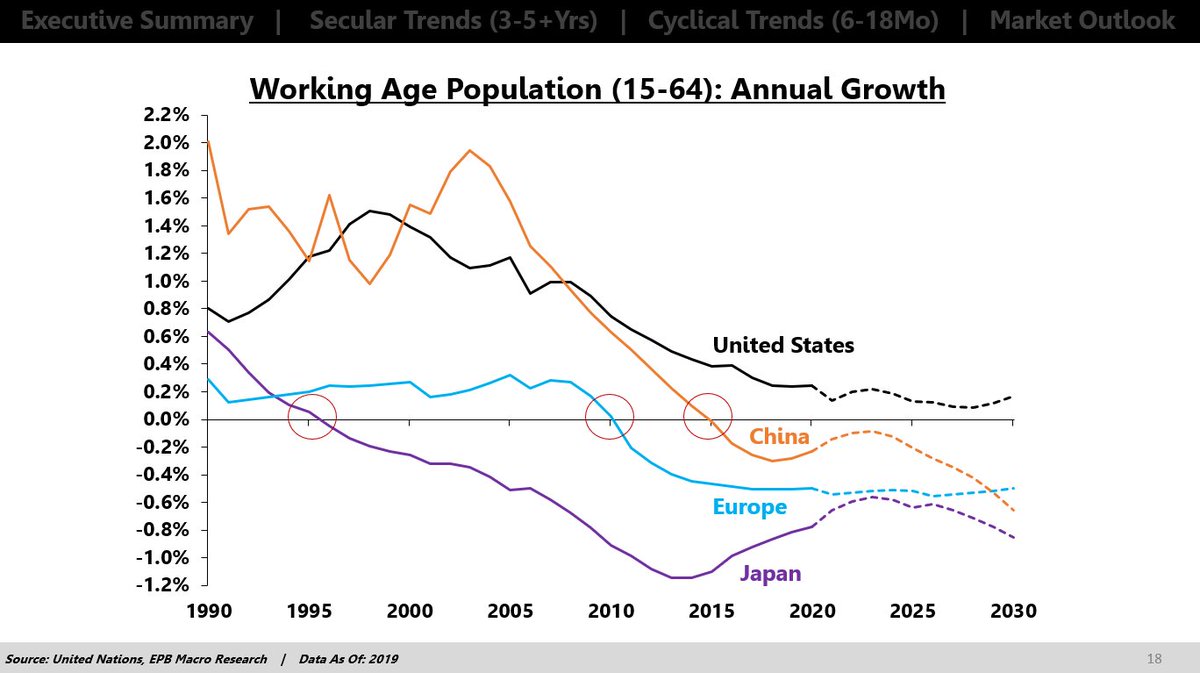
Also, every major nation is a demographic disaster. The US doesn't have great demographics, but we have less debt and better demographics than everyone else.
By a lot.
21/25
By a lot.
21/25
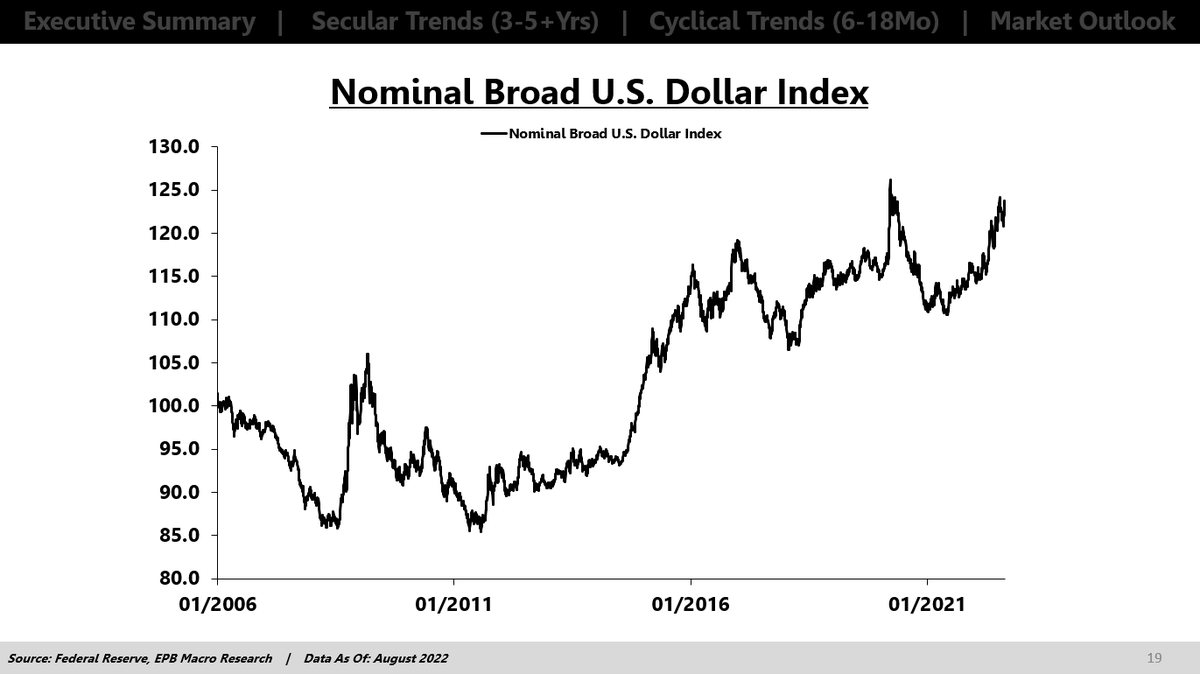
So the result has been a booming US Dollar, even with all the problems I just outlined, and the results going forward will look very similar.
More government borrowing, wider trade deficits, lower national savings, and lower productive investment in critical areas.
22/25
More government borrowing, wider trade deficits, lower national savings, and lower productive investment in critical areas.
22/25
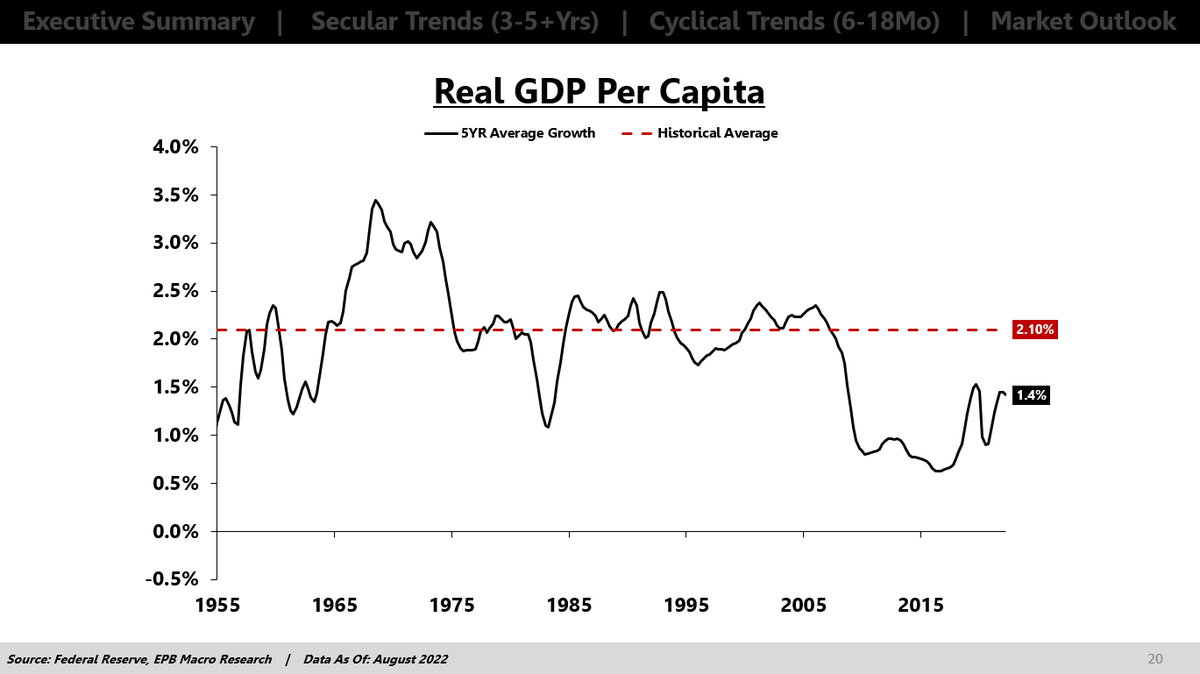
The failure to sustain productivity-enhancing investment will cause real GDP growth to continue collapsing.
Sustained 2% growth is a thing of the past
The economy will become anemic without government assistance
1% or even 0% rates of real growth will be the new normal
23/25
Sustained 2% growth is a thing of the past
The economy will become anemic without government assistance
1% or even 0% rates of real growth will be the new normal
23/25
If you liked any part of this thread, please give me follow @EPBResearch for more content like this.
Follow: twitter.com/EPBResearch
24/25
Follow: twitter.com/EPBResearch
24/25
Also, check out this entire thread in video form on my YouTube channel!
I'm a visual guy, so I always think the videos are better than the threads.
Watch Video Here:
Thanks!
25/25
I'm a visual guy, so I always think the videos are better than the threads.
Watch Video Here:
Thanks!
25/25
• • •
Missing some Tweet in this thread? You can try to
force a refresh