The basics of ROE, ROCE & ROIC explained from scratch with multiple case studies 🧵🧵🧵
In this thread we will cover:
1⃣ Du Pont of ROE
2⃣ Du Pont of ROCE
3⃣ Going Beyond as Investors
4⃣ Du Pont of ROIC
Retweet to educate Maximum Investors!! 👇👇
In this thread we will cover:
1⃣ Du Pont of ROE
2⃣ Du Pont of ROCE
3⃣ Going Beyond as Investors
4⃣ Du Pont of ROIC
Retweet to educate Maximum Investors!! 👇👇

First ratio is Return on Equity:-
ROE indicates a company’s profitability by measuring how much the shareholders earned for their investment in the company.
ROE signifies how good the company is in generating returns on the investment it received from shareholders.
ROE indicates a company’s profitability by measuring how much the shareholders earned for their investment in the company.
ROE signifies how good the company is in generating returns on the investment it received from shareholders.
The formula of ROE is Profit after Tax ÷ Equity (Net worth)
Where,
Net worth = Equity share capital, and Reserve and Surplus
Companies with a high ROE can generate cash internally and thus they will be less dependent on debt.
Where,
Net worth = Equity share capital, and Reserve and Surplus
Companies with a high ROE can generate cash internally and thus they will be less dependent on debt.
Investors should not make any investment decision on the basis of ROE alone as it may not give a clear picture because debt is not considered here
Companies with high debt may report high ROE
Companies with high debt may report high ROE
Hence it becomes extremely important to look leverage as well and do the dupont of ROE
Dupont of ROE simply means breaking the ROE formula into 3 parts i.e. 👇
Dupont of ROE simply means breaking the ROE formula into 3 parts i.e. 👇
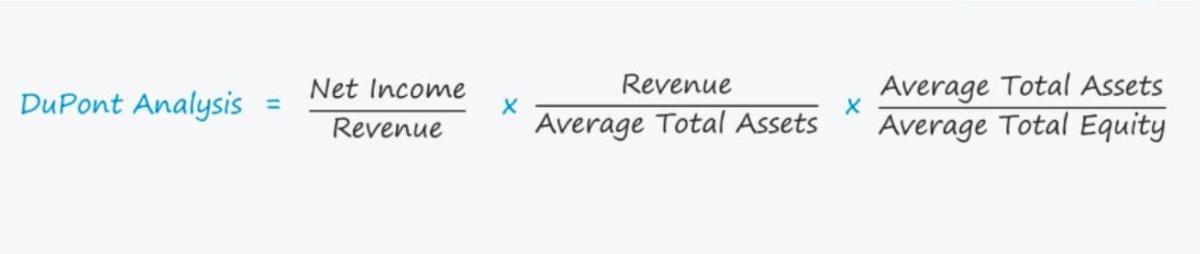
ROE = Net Profit Margin x Asset Turnover Ratio x Financial Leverage
Where,
NPM is calculated as PAT / Sales
Asset Turnover = Sales / Total Assets
Financial Leverage is calculated as Total Assets / Equity
Where,
NPM is calculated as PAT / Sales
Asset Turnover = Sales / Total Assets
Financial Leverage is calculated as Total Assets / Equity
The DuPont analysis implies that a company can increase its ROE if it:
▶️Generates Higher Net Profit Margin
▶️Efficiently Utilizes Assets to Generate More Revenue
▶️Increases its Financial Leverage
▶️Generates Higher Net Profit Margin
▶️Efficiently Utilizes Assets to Generate More Revenue
▶️Increases its Financial Leverage
Lets look at a Pharma co which had done huge capex during FY17 - FY19
In pharma co's post completion of project co's have to wait for regulatory approvals, during that phase revenue from new plant will be low but depreciation will be charged on those asset leading to low PAT
In pharma co's post completion of project co's have to wait for regulatory approvals, during that phase revenue from new plant will be low but depreciation will be charged on those asset leading to low PAT
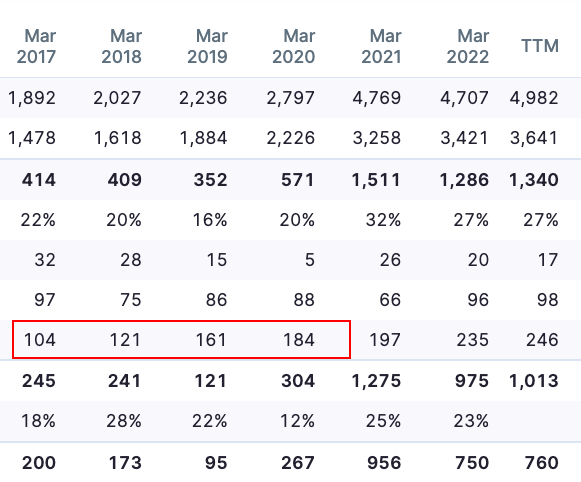
During that phase its ROE got depressed as:
🔽Asset Turnover was low
⬆️Financial leverage was high
🔽Net Profit Margin due to high Depreciation
🔽Asset Turnover was low
⬆️Financial leverage was high
🔽Net Profit Margin due to high Depreciation
So here ROE during approval phase was just 6% but once company got approval and revenue from that plant started flowing in ROCE blasted and expanded to 35% in FY21.
Another example is of a steel wire company which was heavily leveraged till FY19 its D/E was 4.56 times, in FY20 co sold its steel plant and paid off most of its borrowings which brings down its debt from 3565 cr to 620 cr in FY20 & currently at 411 cr in FY22.
Just check the deleveraging on the Balance Sheet:-
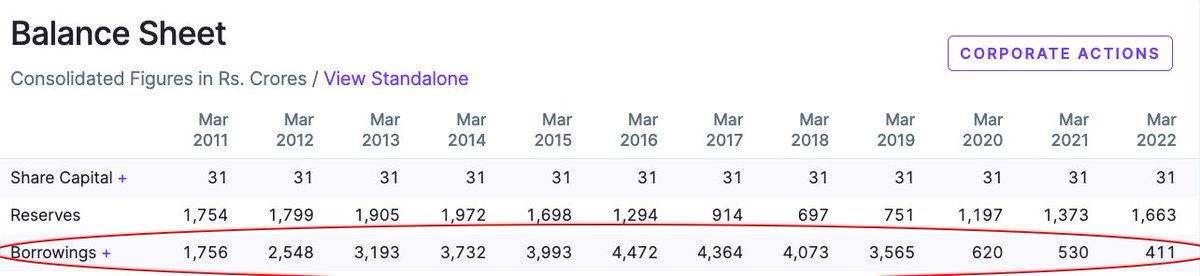
The ROE of the company went up from 6% in FY19 to 17% in FY22.
Net impact:
Total Asset Turnover 🔼 sale of plant
Net Profit Margin 🔼 interest cost came down
Financial Leverage 🔽 due to debt repayment
ROE = NPM x Total Asset Turnover x Financial Leverage
Return on Equity ⏫
Net impact:
Total Asset Turnover 🔼 sale of plant
Net Profit Margin 🔼 interest cost came down
Financial Leverage 🔽 due to debt repayment
ROE = NPM x Total Asset Turnover x Financial Leverage
Return on Equity ⏫
The next most important ratio which we will be discussing is Return on Capital Employed.
It measures how well a company is able to generate profits from its capital.
Higher ROCE is more favourable, as it indicates more profits are generated per rupee of capital employed.
It measures how well a company is able to generate profits from its capital.
Higher ROCE is more favourable, as it indicates more profits are generated per rupee of capital employed.
This ratio is similar to ROE, but it is more comprehensive as it includes the returns generated from debt as well
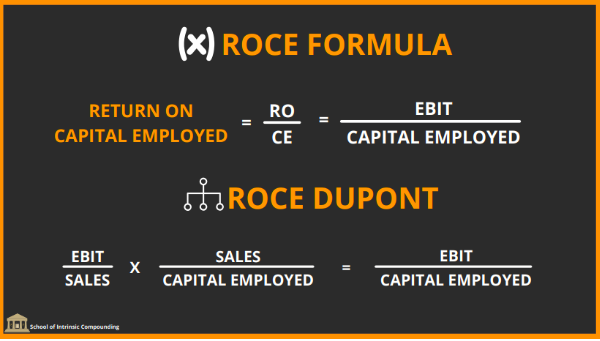
Return on Capital Employed (ROCE) = EBIT / Capital Employed
Where
EBIT = Net Profit Before Interest and Taxes
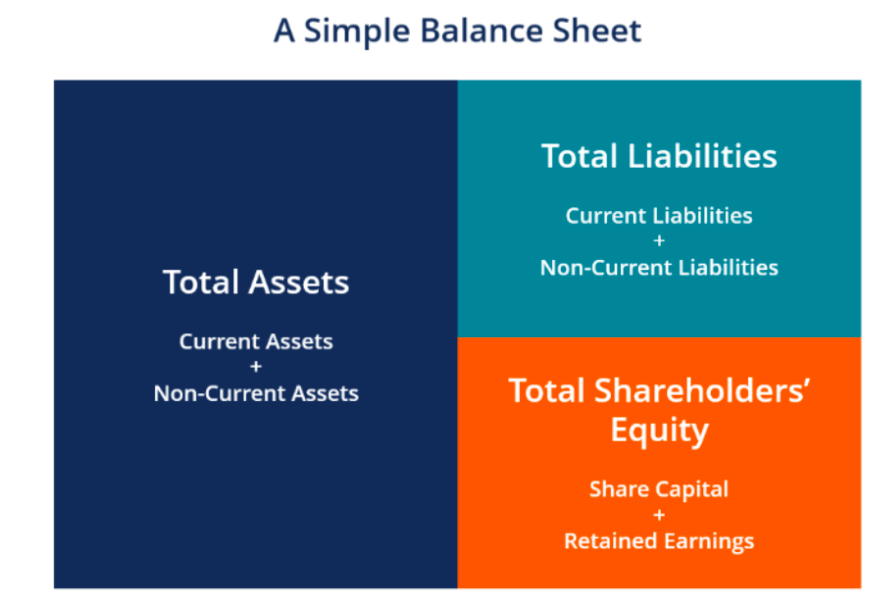
Capital Employed = Total Assets – Current Liabilities
Return on Capital Employed (ROCE) = EBIT / Capital Employed
Where
EBIT = Net Profit Before Interest and Taxes
Capital Employed = Total Assets – Current Liabilities
ROCE provides a better indication of financial performance for companies with significant debt.
It follows from the equation that in order to generate high ROCE, a company must either have very high profit margins or need low levels of Capital Employed or a combination of both.
It follows from the equation that in order to generate high ROCE, a company must either have very high profit margins or need low levels of Capital Employed or a combination of both.
When we look at the Du Pont of ROCE so here we can divide it into 2 parts:
ROCE = EBIT Margins x Capital Employed Turnover
Where,
EBIT Margins = EBIT / Sales
Capital Employed Turnover = Sales / Capital Employed
ROCE = EBIT Margins x Capital Employed Turnover
Where,
EBIT Margins = EBIT / Sales
Capital Employed Turnover = Sales / Capital Employed
Lets cover some case studies to understand it better:
A Cable & Wire company is shifting its product mix from EPC business which is government contract to retail segment.
The reason for such change is in EPC business working capital requirement is high due to higher debtor days
A Cable & Wire company is shifting its product mix from EPC business which is government contract to retail segment.
The reason for such change is in EPC business working capital requirement is high due to higher debtor days
Now when the product mix will change from EPC to Retail the capital employed requirement will come down.
Along with that since margins in retail segment are high so EBIT will go up.
These both will lead to expansion in ROCE of the company.
EBIT🔼
Capital Employed🔽
ROCE ⏫⏫
Along with that since margins in retail segment are high so EBIT will go up.
These both will lead to expansion in ROCE of the company.
EBIT🔼
Capital Employed🔽
ROCE ⏫⏫
Going Beyond ROCE!
Another example is SRF Limited which has 3 business segments:
1⃣ Specialty Chemicals
2⃣ Packing Film Business
3⃣ Technical Textile Business
Another example is SRF Limited which has 3 business segments:
1⃣ Specialty Chemicals
2⃣ Packing Film Business
3⃣ Technical Textile Business

During 2015 - 2018 company was doing capex in its agrochemicals division when the agrochem cycle was in downturn as industry was consolidating
The chemicals division during that time was yielding ROCE of 10% - 12% as compared to 22% in textiles division.
The chemicals division during that time was yielding ROCE of 10% - 12% as compared to 22% in textiles division.
These investments started giving results when cycle turned and industry consolidation completed and now the ROCE of chemicals division is 22%.
As investors we should always be forward looking as past performance will never help you in making wealth.
Another such example is a company which intentionally capped its ROCE at 15-17% to prevent itself from intense competition.
Another such example is a company which intentionally capped its ROCE at 15-17% to prevent itself from intense competition.
They scaled up and backwards integrated which has now become an entry barrier for other players in the industry.
Now it will be very difficult for others to make even 15% ROCE in that business.
Low ROCE can also be a strategy of business to create entry barriers.
Now it will be very difficult for others to make even 15% ROCE in that business.
Low ROCE can also be a strategy of business to create entry barriers.
Moving towards the last and most important ratio in investing which most investors miss while analysing businesses is Return on Invested Capital (ROIC).
ROIC tells us the rate of return the company is generating on capital that has been invested in the business.
ROIC tells us the rate of return the company is generating on capital that has been invested in the business.
ROIC is calculated as Net Operating Profit After Tax (NOPAT) / Invested Capital
Where,
NOPAT is calculated as EBIT x (1 - Tax Rate); and
Invested Capital is calculated as Equity + Debt - Cash
Where,
NOPAT is calculated as EBIT x (1 - Tax Rate); and
Invested Capital is calculated as Equity + Debt - Cash
ROIC is used to determine whether or not a company has a economic moat which is the ability to protect its profit margins and market share from new market entrants in the long run.
Higher the ROIC, the more likely the company is to achieve sustainable long-term wealth creation.
Higher the ROIC, the more likely the company is to achieve sustainable long-term wealth creation.
We can further expand the formula in 2 parts to understand the Du Pont of the ROIC:
ROIC = Operating Margin Ratio x Invested Capital Turnover
Where,
Operating Margin Ratio = NOPAT / Sales
Invested Capital Turnover = Sales / Invested Capital
ROIC = Operating Margin Ratio x Invested Capital Turnover
Where,
Operating Margin Ratio = NOPAT / Sales
Invested Capital Turnover = Sales / Invested Capital
“Leaving the question of price aside, the best business to own is one that over an extended period can employ large amounts of incremental capital at very high rates of return.”
- Warren Buffett
- Warren Buffett
Thank you so much for reading!!
If you enjoyed the thread do consider retweeting :)
We are doing a detailed session and a live class on ROE vs ROCE vs ROIC with Multiple Live case Studies on 17th September.
Here is the link to register🔗:rzp.io/l/HZy4mZI
If you enjoyed the thread do consider retweeting :)
We are doing a detailed session and a live class on ROE vs ROCE vs ROIC with Multiple Live case Studies on 17th September.
Here is the link to register🔗:rzp.io/l/HZy4mZI
• • •
Missing some Tweet in this thread? You can try to
force a refresh