If you pick stocks, you MUST learn how to read a Cash Flow Statement.
Here’s everything you need to know:
Here’s everything you need to know:
The Cash Flow Statement shows how cash moves in and out of a company over a period of time.
Its purpose is to track cash movement through a business.
It's kind of like your checking account statement from your bank.
Its purpose is to track cash movement through a business.
It's kind of like your checking account statement from your bank.
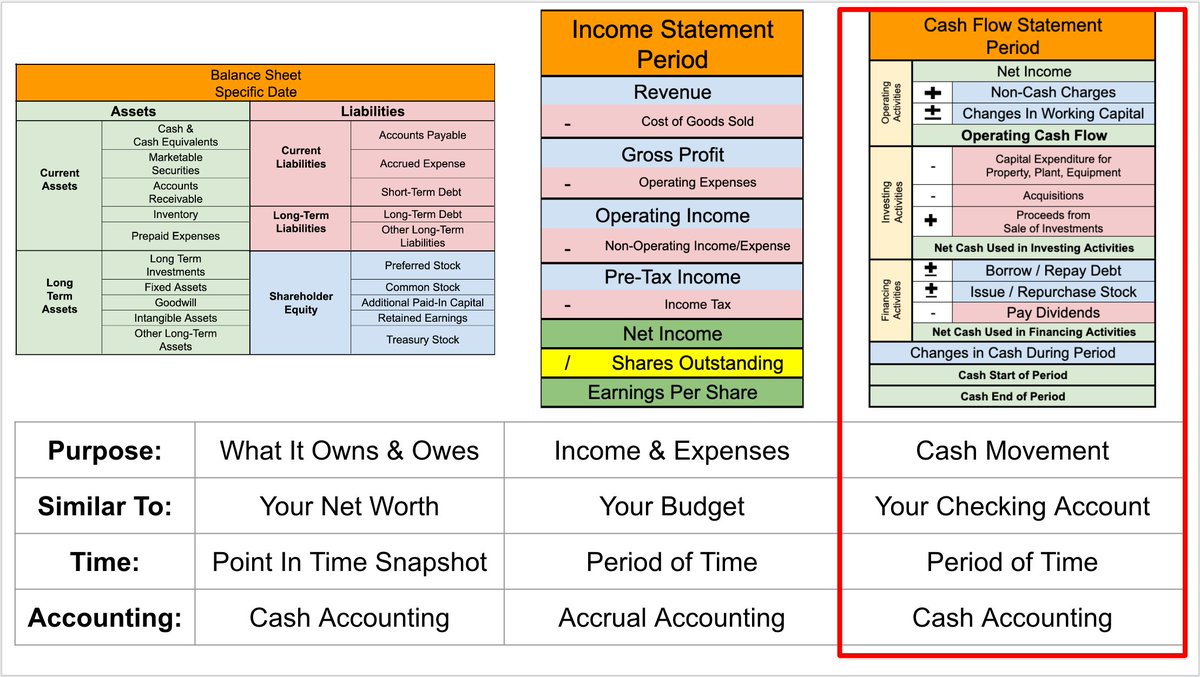
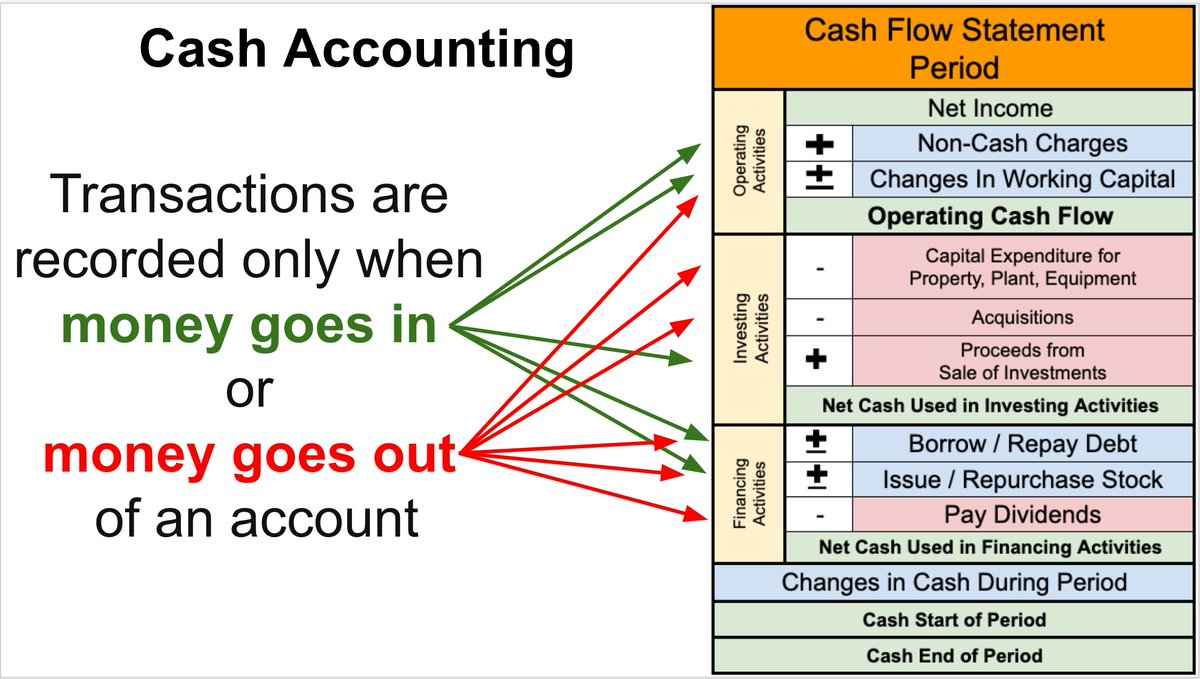
The Cash Flow Statement uses CASH accounting.
This method only records transactions when money goes in or out of an account.
This differs from ACCRUAL accounting, which is the accounting method used on the Income Statement and Balance Sheet
This method only records transactions when money goes in or out of an account.
This differs from ACCRUAL accounting, which is the accounting method used on the Income Statement and Balance Sheet
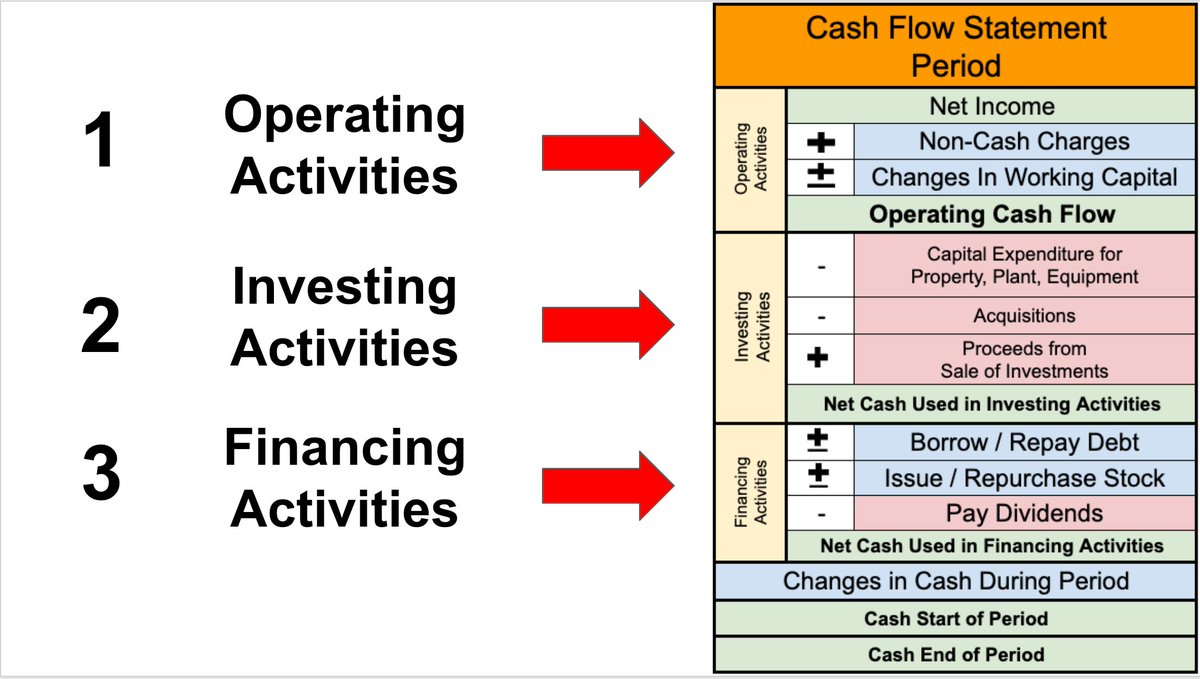
There are three main segments to a Cash Flow Statement:
1. Operating Activities
2. Investing Activities
3. Financing Activities
Companies get some leeway with how they break out each segment, but they all follow this basic structure:
1. Operating Activities
2. Investing Activities
3. Financing Activities
Companies get some leeway with how they break out each segment, but they all follow this basic structure:
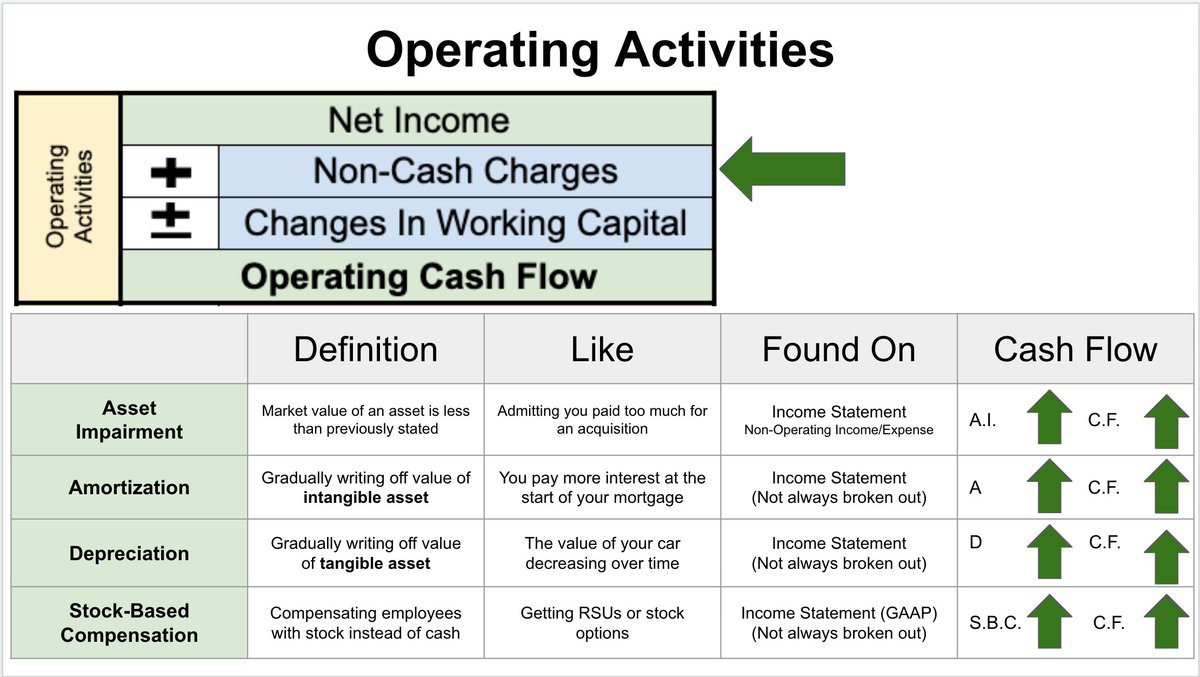
First is Operating Activities.
This section shows cash movements from all normal operational business activities.
Operating Activities STARTS with net income, which is the bottom number of the Income Statement
This section shows cash movements from all normal operational business activities.
Operating Activities STARTS with net income, which is the bottom number of the Income Statement

Non-cash charges are ADDED back as a source of cash.
Common categories:
▪️Asset Impairment
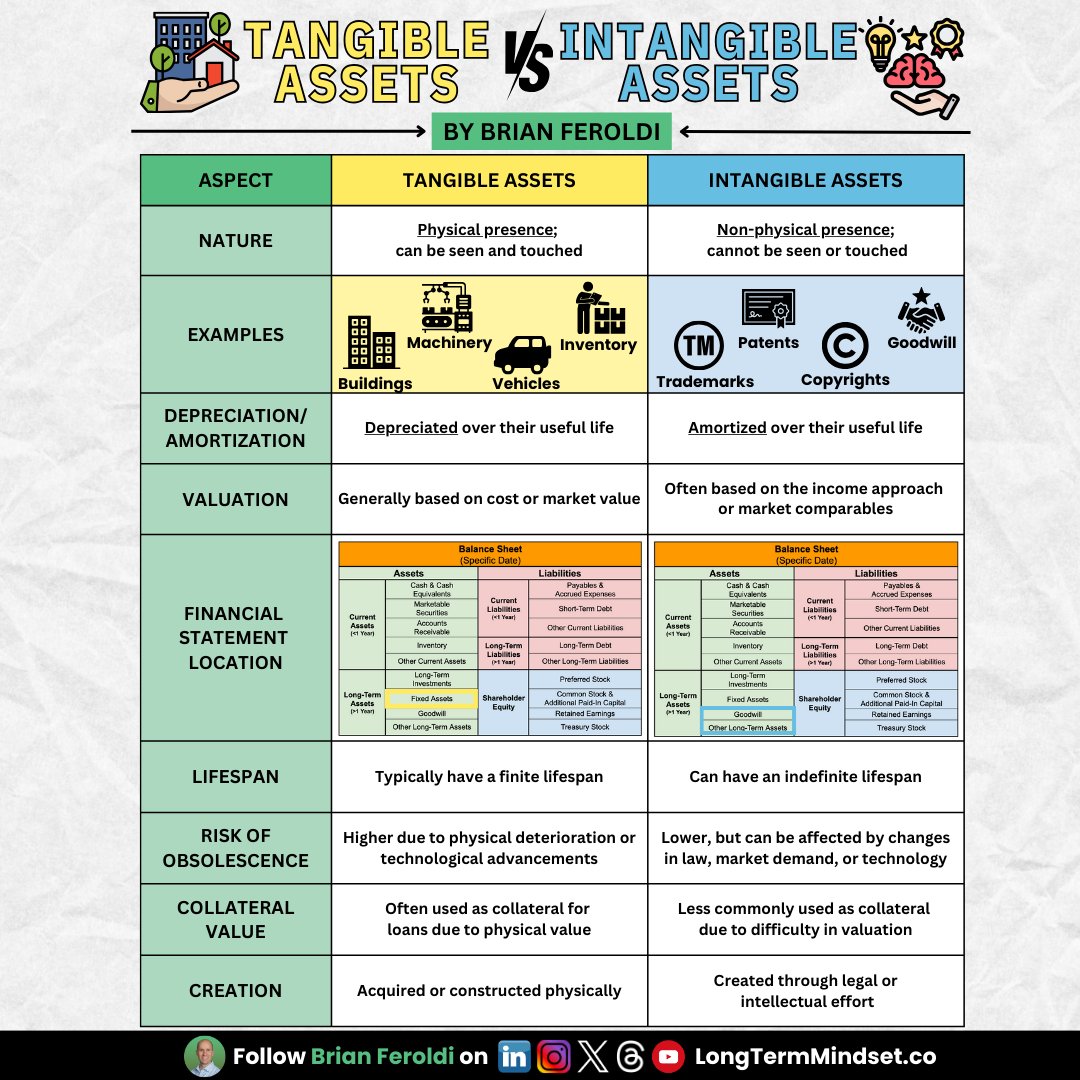
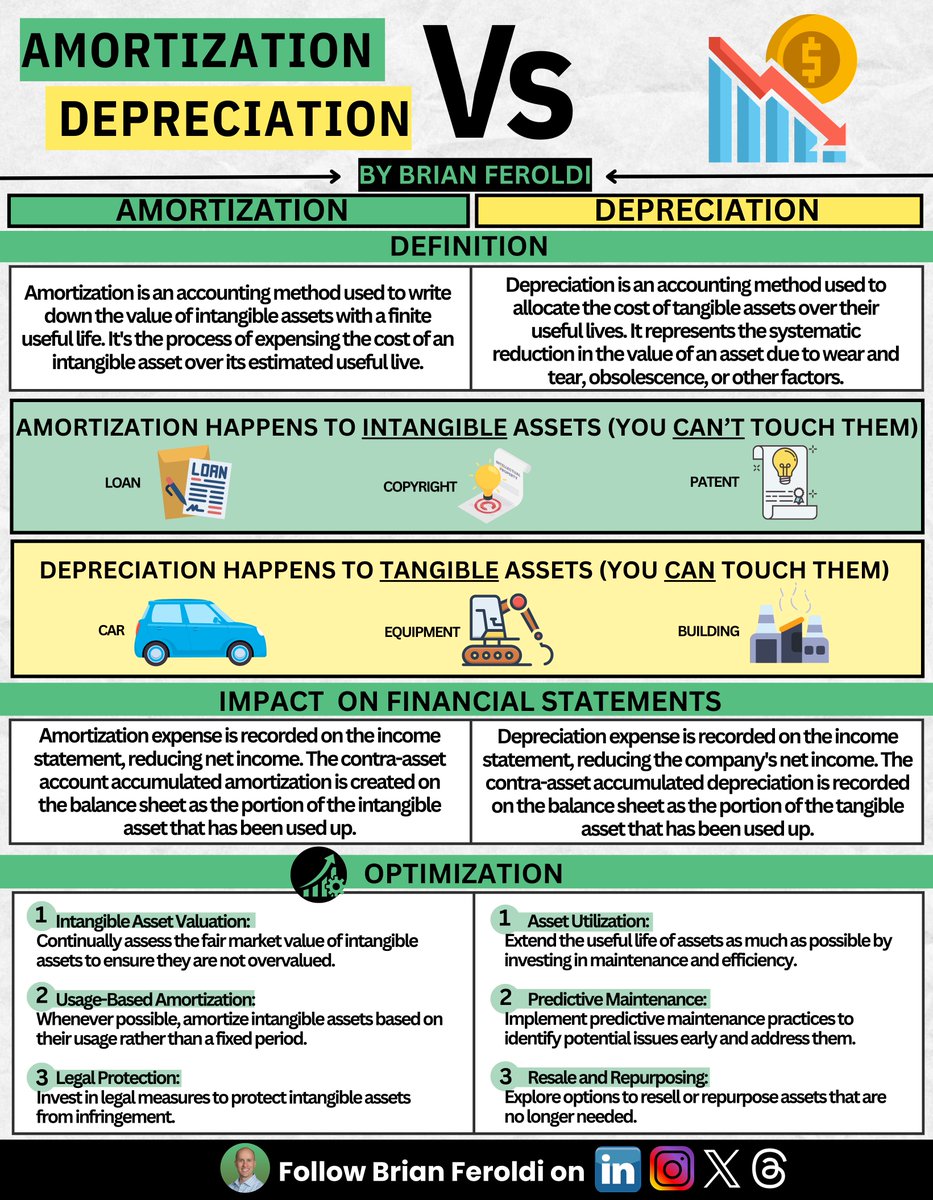
▪️Amortization
▪️Depreciation
▪️Stock-Based Compensation
Common categories:
▪️Asset Impairment
▪️Amortization
▪️Depreciation
▪️Stock-Based Compensation
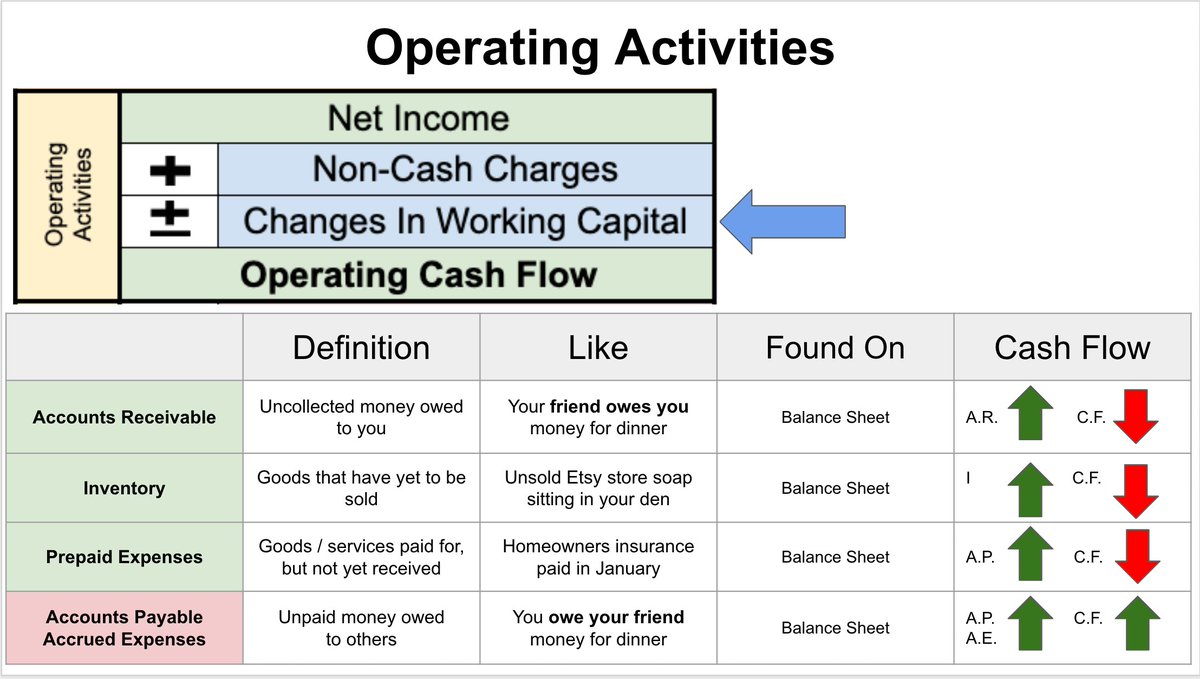
Next is Working Capital, which can ADD or SUBTRACT from cash flow:
Common Categories:
▪️Accounts Receivable
▪️Accounts Payable
▪️Inventory
▪️Prepaid Expenses
Common Categories:
▪️Accounts Receivable
▪️Accounts Payable
▪️Inventory
▪️Prepaid Expenses
The next section is called Cash Flows from Investing Activities.
The shows the cash gains and losses from investments the business has made.
The shows the cash gains and losses from investments the business has made.
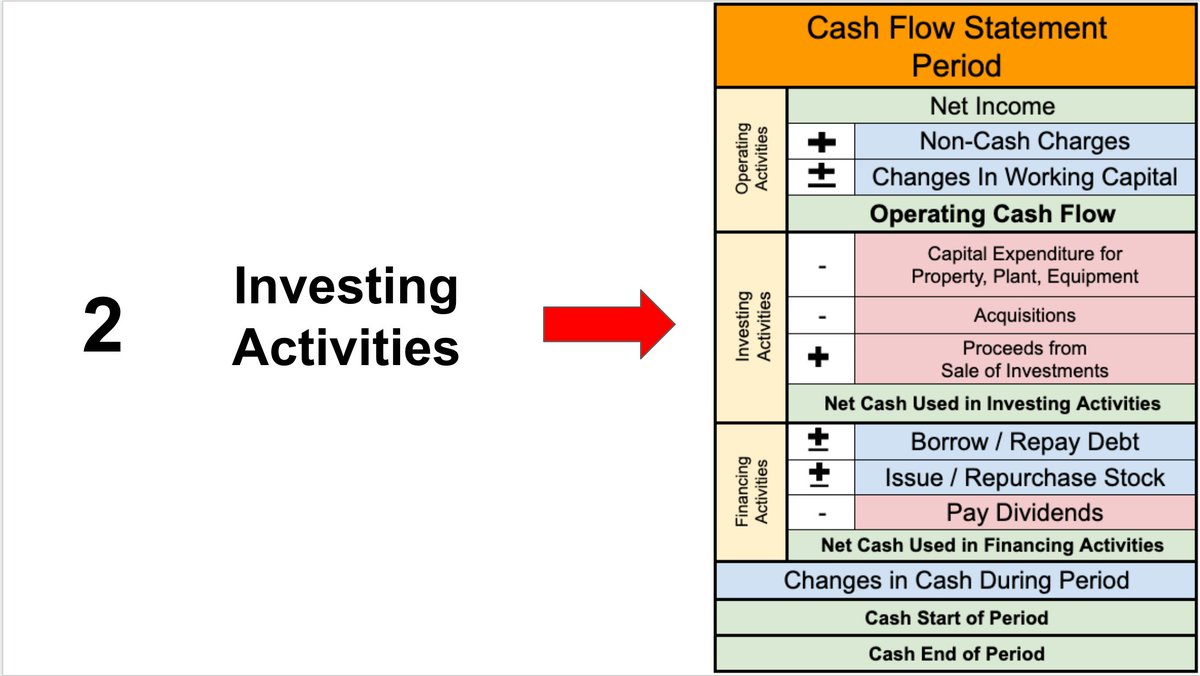
Cash expenses are SUBTRACTED while assets sales are ADDED
Common Categories:
▪️Capital Expenditure (CAPEX)
▪️Acquisitions
▪️Proceeds from the sale of investments
Common Categories:
▪️Capital Expenditure (CAPEX)
▪️Acquisitions
▪️Proceeds from the sale of investments

We can now calculate Free Cash Flow (FCF)!
FCF is the cash that is left after a company has paid for its Operating Expenses and CAPEX.
The formula:
FCF = Operating Cash Flow - Capex
FCF is the cash that is left after a company has paid for its Operating Expenses and CAPEX.
The formula:
FCF = Operating Cash Flow - Capex

The final section is called Cash Flows from Investing Activities.
This measures the cash movements between a company and its owners (shareholders) and its creditors (bondholders).
This measures the cash movements between a company and its owners (shareholders) and its creditors (bondholders).
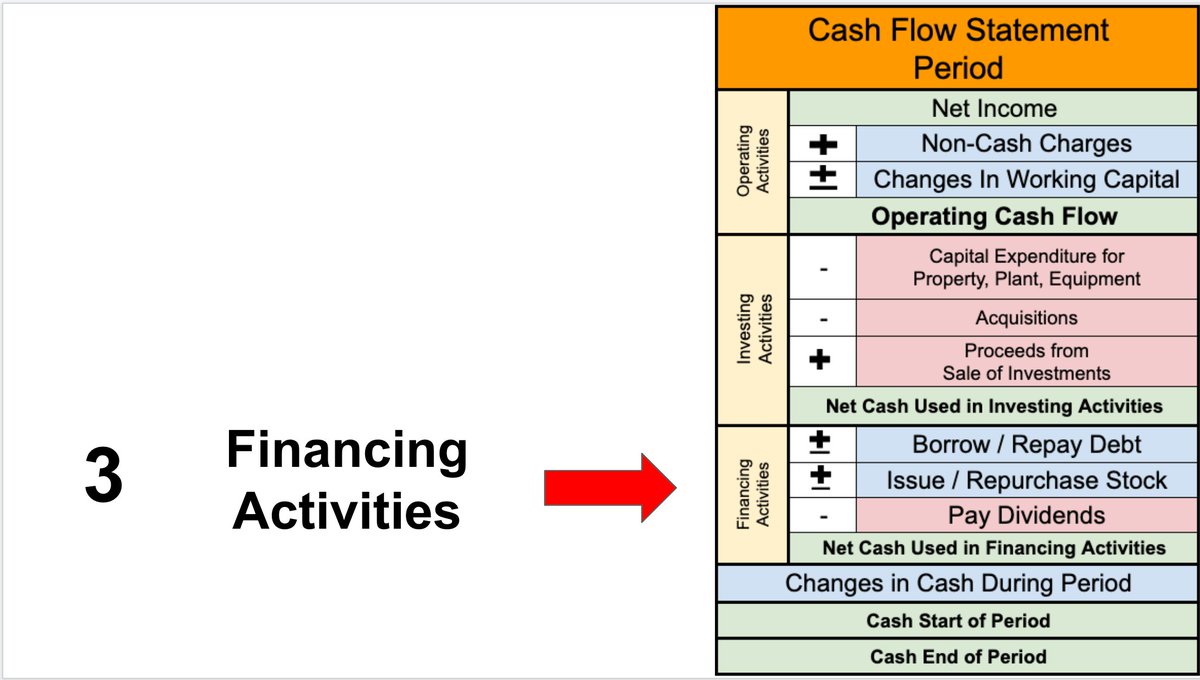
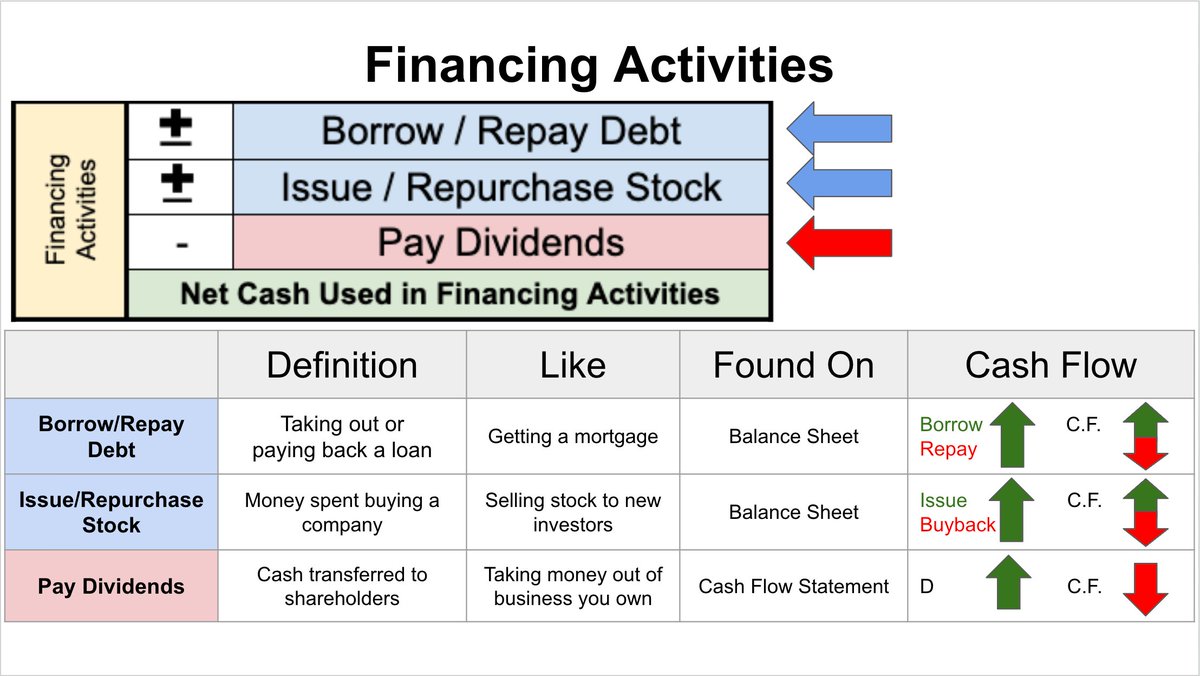
Cash inflows are ADDED while cash outflows are SUBTRACTED
Common categories:
▪️Debt: Issued or repaid
▪️Stock: Issued or repurchased
▪️Dividends
Common categories:
▪️Debt: Issued or repaid
▪️Stock: Issued or repurchased
▪️Dividends
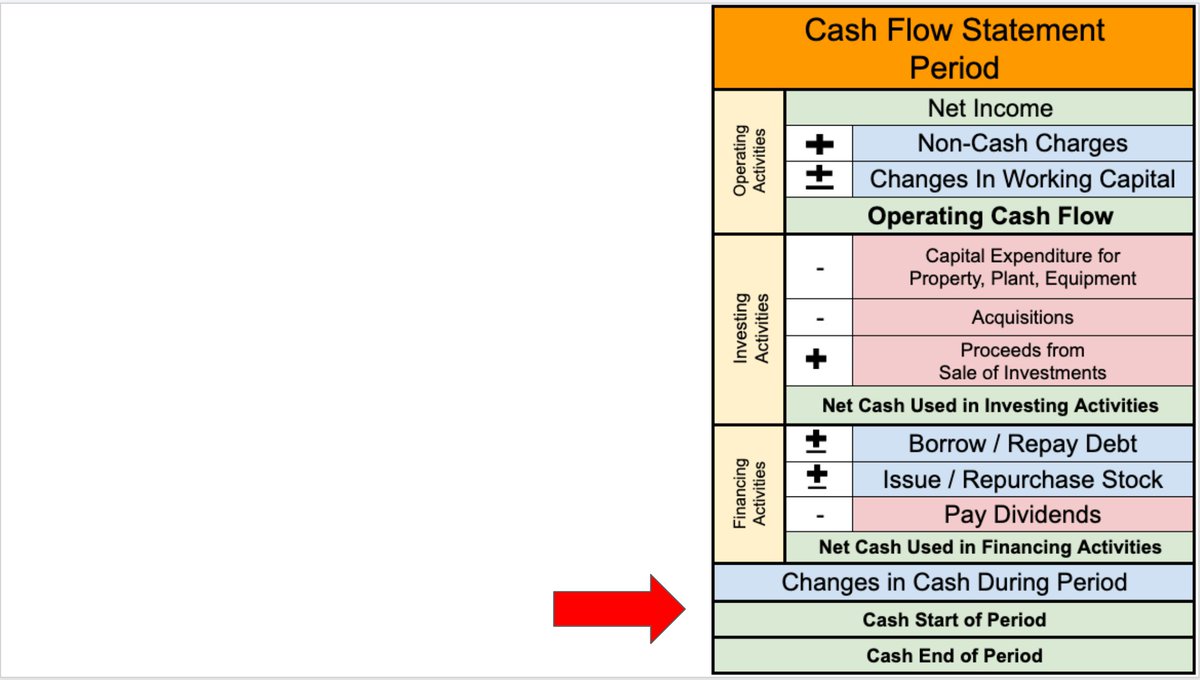
The final section shows the total changes in the cash balance during the period.
Its shows:
1⃣Sum of Operating Activities + Investing Activities + Financing Activities
2⃣Starting Cash Balance
3⃣Ending Cash Balance
Its shows:
1⃣Sum of Operating Activities + Investing Activities + Financing Activities
2⃣Starting Cash Balance
3⃣Ending Cash Balance
The Cash Flow statement has tons of nuance, but it's arguably the most important financial statement to master.
That's especially true in hard economic times (like right now).
That's especially true in hard economic times (like right now).
If you pick stocks, it's CRITICAL to learn accounting.
Want help? @Brian_Stoffel_ and I created a course that teaches accounting in plain English
Registration is currently open.
Interested? DM me for a special coupon code.
maven.com/brian-feroldi/…
Want help? @Brian_Stoffel_ and I created a course that teaches accounting in plain English
Registration is currently open.
Interested? DM me for a special coupon code.
maven.com/brian-feroldi/…
Prefer to keep learning for free?
Read this thread about the Balance Sheet next:
Read this thread about the Balance Sheet next:
https://twitter.com/BrianFeroldi/status/1566382865503453185?s=20&t=B14xjZzfQ_N3s9nGLf0y9A
• • •
Missing some Tweet in this thread? You can try to
force a refresh