To those who believe that most Omicron deaths are incidental....
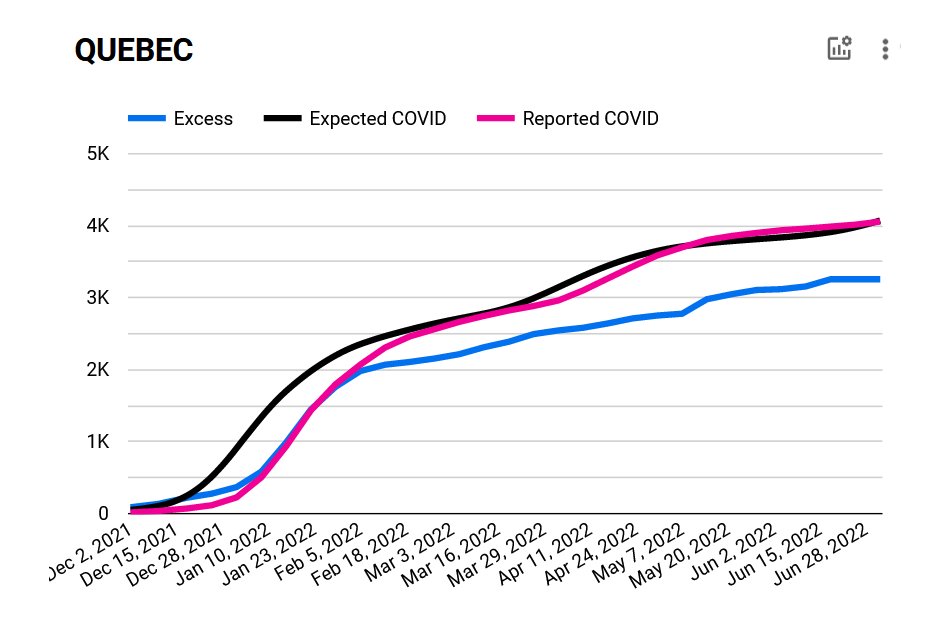
I give you Quebec's total cumulative REPORTED (pink), and EXCESS (blue) deaths since Dec 2/21.
Black: expected, based on estimated infections (leads by ~2 weeks)
Wanna see Ontario?
I give you Quebec's total cumulative REPORTED (pink), and EXCESS (blue) deaths since Dec 2/21.
Black: expected, based on estimated infections (leads by ~2 weeks)
Wanna see Ontario?

Here are cumulative Excess (blue), Reported COVID (pink) and Expected COVID (black) deaths for Ontario since Dec 2/21.
Notice anything?
Notice anything?

Note: we're just starting to see excess mortality for first 1-2 Omicron months. The blue curve flattens because a lot of deaths haven't been reported yet.
For QC, a min of 5.4K deaths for epidemic to Jul 2/22 haven't been reported to Canadian Vital Statistics yet. ON min: 22K.
For QC, a min of 5.4K deaths for epidemic to Jul 2/22 haven't been reported to Canadian Vital Statistics yet. ON min: 22K.
Not sharing other provinces till next week-ish. Just wanted to put these 2 out there, so perhaps decision makers who have under-reported COVID deaths b/c they're deemed "incidental" or "with" not "from" can do some thinking about what your provincial death curves might look like.
Canadians may think we're magically protected from the math of COVID mortality, but we're not, no matter how much hand-waving folks do who should know better.
My apologies. I should explain this better for those who aren't familiar with mortality reporting.
Throughout COVID, many COVID deaths have gone undetected/unreported. The number of "missing" COVID deaths can be estimated from excess mortality.
Throughout COVID, many COVID deaths have gone undetected/unreported. The number of "missing" COVID deaths can be estimated from excess mortality.
Excess deaths are "extra", untimely deaths we wouldn't normally expect to see if this year was like years before COVID.
The excess mortality data we use here are from @StatCan_eng . They're adjusted for population aging.
The excess mortality data we use here are from @StatCan_eng . They're adjusted for population aging.
@StatCan_eng Multiple factors can contribute to excess mortality. To determine if the large increase seen in ON and QC from Dec/21 to end Jan/22 is COVID-related, we show reported COVID deaths on the graph for comparison.
@StatCan_eng You can see QC excess and COVID deaths overlap perfectly for this period.
This means:
1) QC likely detected and reported all/most COVID deaths.
2) The deaths QC reported were NOT deaths of people who would have died anyway of another cause (incidental). They were COVID deaths.
This means:
1) QC likely detected and reported all/most COVID deaths.
2) The deaths QC reported were NOT deaths of people who would have died anyway of another cause (incidental). They were COVID deaths.

@StatCan_eng To this graph we also add Expected COVID deaths (black). This is the number of deaths expected based on estimated infection numbers 2 weeks earlier and the Omicron population infection fatality rate for QC.
We use this to estimate how many infections happened that led to death.
We use this to estimate how many infections happened that led to death.

@StatCan_eng The Expected deaths lead by ~2 weeks because they're shown for the dates that infections occurred which likely led to deaths ~2 weeks later.
@StatCan_eng These are cumulative numbers, so we expect the pink, black and blue lines to meet up over time, or follow the same trends, if reporting is complete, and if all reported COVID deaths are "excess", untimely deaths.
@StatCan_eng Cumulative = total FYI
@StatCan_eng In reality, probably some reported/expected COVID deaths should not show up in excess deaths. This is because a lot of people who die of COVID are in their 80s, and might have died at about the same time of other causes--so they won't show up as "excess"/untimely deaths.
If 100% of the population is infected with Omicron (likely before the end of this year), we'd expect some of those deaths might be "incidental"--or people who would have died anyway.
But...we've recently started estimating population infection fatality rates, infections and deaths for Canada using age-specific COVID mortality rates that are based on excess mortality by age group, NOT reported COVID mortality.
I think this is partly why QC's excess and reported COVID deaths match so perfectly up to the end of Jan.
We're still waiting for a lot more death reporting to come in, but we might expect some "flattening" of excess mortality for a bit after Jan due to something called "displacement mortality". This is people who died of COVID in Dec/Jan who might have normally died in Feb/March.
Anyway, we'll wait and see.
And most provinces haven't reported any deaths at all to Vital Statistics for the Omi period, or a tiny fraction, so we have no idea what's happening.
And most provinces haven't reported any deaths at all to Vital Statistics for the Omi period, or a tiny fraction, so we have no idea what's happening.
In fact, we're still seeing COVID deaths for the first wave in 2020 showing up in the Vital Stats database, and there are quite a few that were reported by provinces for that period that still haven't showed up in the national mortality registry.
"Maybe" by Dec of this year we'll have a nearly complete picture of mortality during the first wave of the epidemic.
Canada's death reporting is incredibly slow compared to other high income democratic OECD countries.
Canada's death reporting is incredibly slow compared to other high income democratic OECD countries.
Our excess mortality tracker is at the link here, for those who want to look at what's happened during the epidemic to date.
covid19resources.ca/public-resourc…
covid19resources.ca/public-resourc…
Here's a thread on excess mortality I did earlier this week:
https://twitter.com/MoriartyLab/status/1568314689851113472?s=20&t=htXDqx8Z1vm4qo_nhbijDA
The following tweets show NL, SK, AB and BC. We don't have death reporting for the Omicron period yet for other provinces.
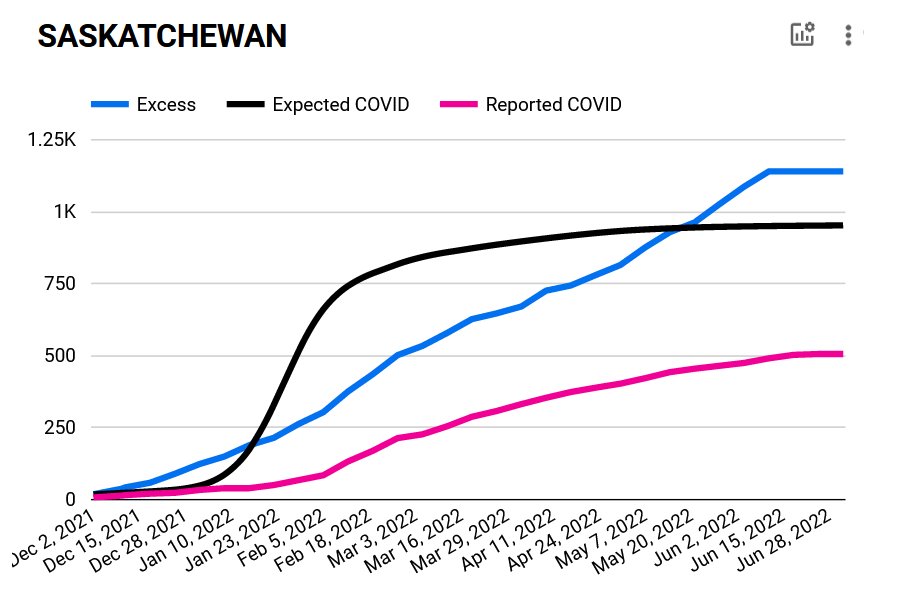
There is a LOT of outstanding death reporting for NL, SK, AB and BC, which may be why excess mortality is showing as a straight-ish line still.
There is a LOT of outstanding death reporting for NL, SK, AB and BC, which may be why excess mortality is showing as a straight-ish line still.
Newfoundland and Labrador
I think there may be substantial excess mortality due to toxic drugs or some other factor mixed in there. Working on figuring this out.
I think there may be substantial excess mortality due to toxic drugs or some other factor mixed in there. Working on figuring this out.

Saskatchewan
There may also be excess mortality due to non-COVID causes in there--most likely: toxic drugs
The timing of our estimates of when large numbers of COVID infections might also be off. Time will tell.
There may also be excess mortality due to non-COVID causes in there--most likely: toxic drugs
The timing of our estimates of when large numbers of COVID infections might also be off. Time will tell.

Here are provinces for which no deaths have yet been reported to national vital statistics for the Omicron period, or so few that there's a tiny blip then nothing.
Manitoba
Manitoba and Quebec are the two provinces that generally report COVID deaths well--i.e. close to expected numbers.
Manitoba and Quebec are the two provinces that generally report COVID deaths well--i.e. close to expected numbers.

• • •
Missing some Tweet in this thread? You can try to
force a refresh


