Tara Moriarty Profile picture
🏳️‍🌈🇨🇦Assoc Prof @UofT. Bloodborne infections, Lyme disease, misinfo. @COVID_19_Canada. Defend journalism. Opinions mine. @MoriartyLab@bsky.social
19 subscribers
Jan 6 17 tweets 6 min read
Canadian COVID Forecast Jan 4-17, 2025

CANADA

HIGH (no change)

Estimated infections this week: 265,000-308,450

About 1 in every 126 people infected

Compared to lowest point of pandemic in Canada:

-Infections ~6X higher
-Long COVID ~5X higher
-Hospitalizations ~8X higher
-Deaths ~6X higherThis image describes the Canadian COVID Forecast for Nov 23-Dec 06, 2024 by COVID-19 Resources Canada. Canada’s COVID Forecast outlook is HIGH (no change) with a COVID INDEX SCORE of 6.6 About 1 of every 126 people is infected. Estimated infections this week: 265,000-308,450 How much higher are key indicators compared to the lowest point in the COVID pandemic in Canada? Waste water, infections: HIGH; 5.6X higher Long COVID estimate: HIGH; 5.2X higher Hospitalizations, ICU: HIGH; 8.1X higher Deaths: HIGH; 5.9X higher HOW TO HELP: EVERYONE: UPDATE vaccines every 6 months WEAR N95-type masks  ... Prévisions régionales sur la COVID-19 se trouvent ici :

Dec 22, 2024 17 tweets 6 min read
Canadian COVID Forecast Dec 21, 2024-Jan 3, 2025

CANADA

VERY HIGH (decreasing)

Estimated infections this week: 498,200-511,200

About 1 in every 82 people infected

Compared to lowest point of pandemic in Canada:

-Infections ~9X higher
-Long COVID ~9X higher
-Hospitalizations ~12X higher
-Deaths ~9X higherThis image describes the Canadian COVID Forecast for Nov 23-Dec 06, 2024 by COVID-19 Resources Canada. Canada’s COVID Forecast outlook is VERY HIGH (decreasing) with a COVID INDEX SCORE of 10.1 About 1 of every 82 people is infected. Estimated infections this week: 498,200-511,200 How much higher are key indicators compared to the lowest point in the COVID pandemic in Canada? Waste water, infections: HIGH; 9.3X higher Long COVID estimate: HIGH; 8.9X higher Hospitalizations, ICU: VERY HIGH; 11.7X higher Deaths: HIGH; 9.1X higher HOW TO HELP: EVERYONE: UPDATE vaccines every 6 months WEAR N95-... Prévisions régionales sur la COVID-19 se trouvent ici :

Dec 19, 2024 11 tweets 6 min read
#CovidIsAirborne #CovidIsntOver #MaskUp #YallMasking #CleanTheAir #CovidCautious
Holiday Dance Night
Risk Scenario Estimator Based on Canadian Forecast

The full thread is also available on the C-19 website, starting on page 8, for easier reading.

lookerstudio.google.com/embed/u/0/repo…Image Note: Forecast data will be posted on the weekend, those pages on the website have not been updated.
Dec 6, 2024 8 tweets 4 min read
The Data Card, “Family Holiday Dinner - Before”, shows how wise it is for everyone to mask while visiting inside.

We looked at a group of 10 people, you’re one of them, gathering for a 3 hour visit. People are chatting, but it’s mostly a quiet group enjoying each other’s company.

The scenario uses an average size dining room, 16 x 32. The airflow is well mixed among this and the other rooms and the outside doors are closed.

What can you do?We don't have our alt text for tables yet but we're working on it. What can you do? Open the windows.

What can you do?

You can make your event even more safe by providing rapid tests beforehand and N95 masks as people arrive. This lets everyone know that you care about their health.

What else can you do?

Set up an Outside Food Zone. ™

If the weather is, ahem, wintery, and you have the resources, get a fire pit going.

Explore other ways to warm the space, maybe candles, those amazing patio heaters, or a tether ball to kick to warm everyone up. Don’t forget to provide gloves and blankets too.

Create an inviting space for people to bring their food out, unmask, safely eat at a distance from the crowd. When they’re ready they can join the folks inside again knowing that they are helping to keep everyone safe.

The “Family Holiday Dinner - Before” Card shows the maximum risk people that take on. We’re using the safest estimate for one-off events that often have visitors from away, may include a super spreader, and carry higher potential risks.
Nov 26, 2024 17 tweets 6 min read
Canadian COVID Forecast Nov 23-Dec 6, 2024

CANADA

SEVERE (no change)

Estimated infections this week: 1,190,200-1,266,300

About 1 in every 43 people infected

Compared to lowest point of pandemic in Canada:

-Infections ~27X higher
-Long COVID ~28X higher
-Hospitalizations ~29X higher
-Deaths ~26X higherThis image describes the Canadian COVID Forecast for Nov 23-Dec 06, 2024 by COVID-19 Resources Canada. Canada’s COVID Forecast outlook is SEVERE (no change) with a COVID INDEX SCORE of 27.3 About 1 of every 43 people is infected. Estimated infections this week: 1,190,200-1,266,300 How much higher are key indicators compared to the lowest point in the COVID pandemic in Canada? Waste water, infections: SEVERE; 27.1X higher Long COVID estimate: SEVERE; 27.6X higher Hospitalizations, ICU: SEVERE; 28.9X higher Deaths: SEVERE; 25.9X higher HOW TO HELP: EVERYONE: UPDATE vaccines every 6 months WEA... Prévisions régionales sur la COVID-19 se trouvent ici :

Nov 26, 2024 17 tweets 6 min read
Prévisions de COVID pour le Canada : NOV 23-DÉC 6, 2024

CANADA

GRAVE (stable)

Infections pendant cette période : 1 190 200-1 266 300

Environ 1 personne sur 43 est infectée

Par rapport au point le plus bas de la pandémie au Canada :

-Infections ~27X 🔺
-COVID longue ~28X 🔺
-Hospitalisations ~29X 🔺
-Décès ~26X 🔺This image describes the Canadian COVID Forecast for Nov 23-Dec 06, 2024 by COVID-19 Resources Canada. Canada’s COVID Forecast outlook is SEVERE (no change) with a COVID INDEX SCORE of 27.3 About 1 of every 43 people is infected. Estimated infections this week: 1,190,200-1,266,300 How much higher are key indicators compared to the lowest point in the COVID pandemic in Canada? Waste water, infections: SEVERE; 27.1X higher Long COVID estimate: SEVERE; 27.6X higher Hospitalizations, ICU: SEVERE; 28.9X higher Deaths: SEVERE; 25.9X higher HOW TO HELP: EVERYONE: UPDATE vaccines every 6 months WEA... The english version of our regional forecast can be found here:

Nov 26, 2024 13 tweets 5 min read
Canadian COVID Forecast: Nov 23-Dec 6, 2024

SEVERE: CAN, AB, BC, MB, NB, NL, North, NS, ON, PEI, QC, SK
VERY HIGH: none
HIGH: none
MODERATE: none

About 1 in 43 people in Canada are CURRENTLY infected. This image shows a series of gauges with the Nov 23-Dec 6, 2024 COVID Forecast scores for Canada, the provinces, and territories. Read from left to right:  Canada: 27.3 - SEVERE Alberta: 30.0 - SEVERE British Columbia: 16.1- SEVERE Manitoba: 30.0 - SEVERE New Brunswick: 28.4 - SEVERE Newfoundland and Labrador: 17.5 -SEVERE North: 25.9 - SEVERE Nova Scotia: 30.0 - SEVERE Ontario: 27.4 - SEVERE Prince Edward Island: 26.2 - SEVERE Quebec: 27.9 - SEVERE Saskatchewan: 30.0 - SEVERE  All COVID Forecast input data and sources are available here: (https://covid19resources.ca/covid-hazard-index/)  F... Notre aperçu national en français :

Nov 17, 2024 5 tweets 4 min read
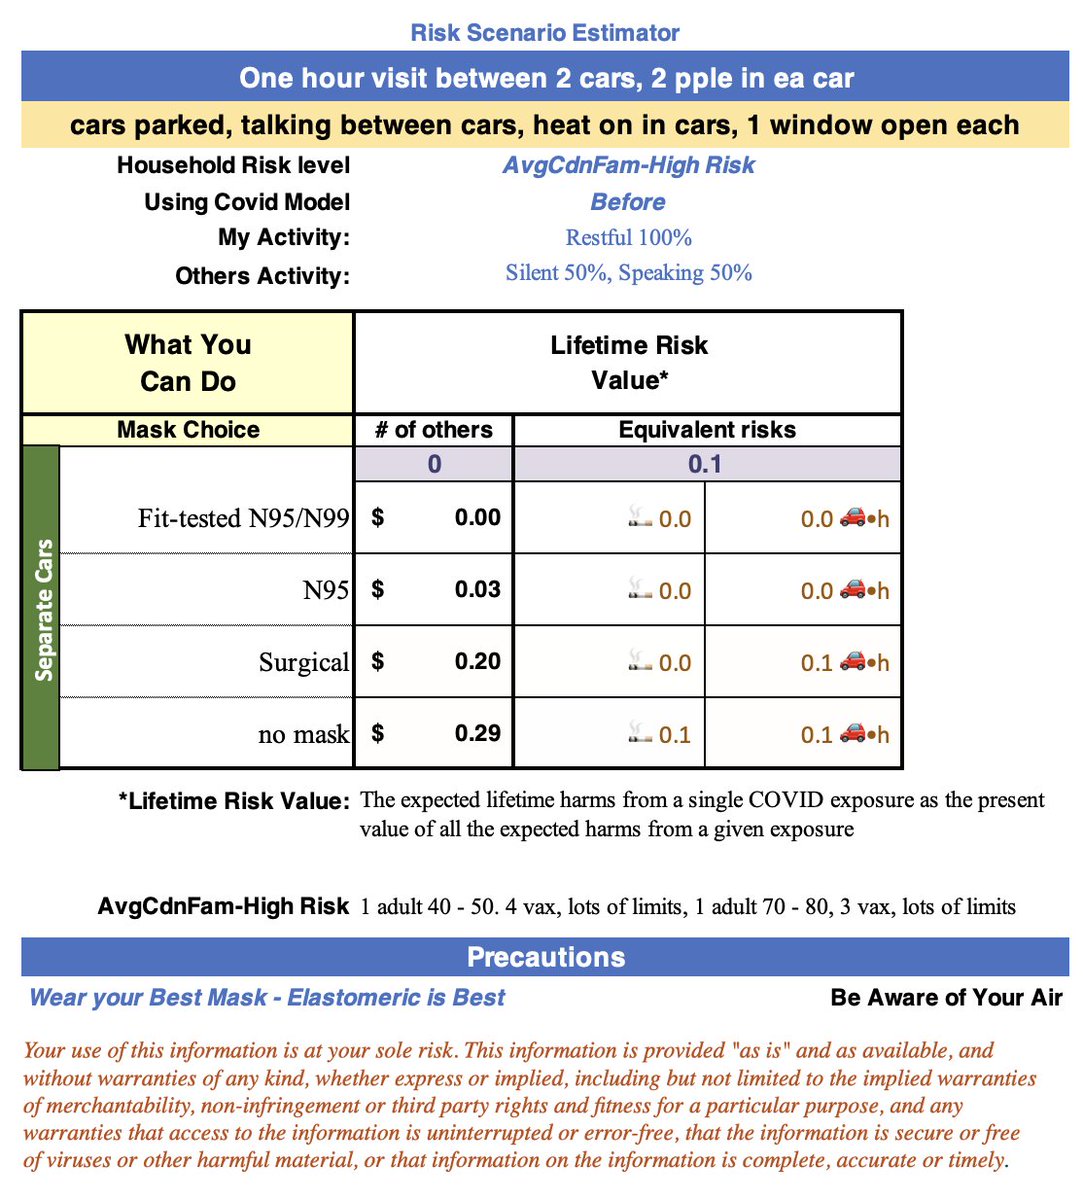
Parking lot Visits in Your Cars
-FYI- This thread is also available on the C-19 website, starting on page 8, for easier reading. Risk Scenario Estimator Based on Canadian Forecast lookerstudio.google.com/embed/u/0/repo…

One of our volunteers wanted to know the risks of meeting their friends in a parking lot, with their cars side by side. How much risk happens in the air transfer between cars? What a great question!

The answer is – not much!

This scenario used the Average Canadian High Risk family this time, since they are more inclined to need and want to take extra precautions while still socializing.A blue-bordered image by Covid-19 Resources Canada with inset frame.  Title: Parking lot Visit in Your Cars Text in light blue coloured box, subtitle: Is it safe to visit between cars? Yes! Text: Rendezvous together to visit with friends, chat in your cars. Image: 2 cars next to Parking sign, red car facing right, blue car facing left. Speech bubbles float above cars.  Image credit: created by vectorportal.com  Footnote:  *Data source: covid19resources.ca and Risk Scenario Estimator.  Text in light blue coloured box:  Activity Risks Two people in each car, windows down, heat on in cars if i... The answer is – not much!

This scenario used the Average Canadian High Risk family this time, since they are more inclined to need and want to take extra precautions while still socializing.

OK, what’s a “car visit”?
Imagine two parked cars:
* Facing opposite directions
* Cars about 1.5 to 2 metres apart
* Driver windows opposite each other
* It it’s cold, heater may be on
We roll down the drivers’ windows and visit!

This is quite safe, as shown in the data cards.
Enjoy a very low risk way to share each other’s company.A blue-bordered image by Covid-19 Resources Canada with inset frame.  Title: Parking lot Visit in Your Cars Text in light blue coloured box, subtitle: Is it safe to visit between cars? Yes! Text: Rendezvous together to visit with friends, chat in your cars. Image: two cars next to Parking sign, red car facing right, blue car facing left. Speech bubbles float above cars.  Image credit: created by vectorportal.com  Footnote: *Data source: covid19resources.ca and Risk Scenario Estimator.  Text in light blue coloured box:  Activity Risks Two people in each car, windows down, heat on in cars if ...
We don’t have alt text for our tables yet but we’re working on it.
Nov 11, 2024 16 tweets 6 min read
Canadian COVID Forecast Nov 9-22, 2024

CANADA

SEVERE (no change)

Estimated infections this week: 837,200-1,830,000

About 1 in every 31 people infected

Compared to lowest point of pandemic in Canada:

-Infections ~23X higher
-Long COVID ~23X higher
-Hospitalizations ~27X higher
-Deaths ~23X higherThis image describes the Canadian COVID Forecast for Nov 9-22, 2024 by COVID-19 Resources Canada. Canada’s COVID Forecast outlook is SEVERE (no change) with a COVID INDEX SCORE of 24.1 About 1 of every 31 people is infected. Estimated infections this week: 837,200-1,830,000 How much higher are key indicators compared to the lowest point in the COVID pandemic in Canada? Waste water, infections: SEVERE; 22.8X higher Long COVID estimate: SEVERE; 23.4X higher Hospitalizations, ICU: SEVERE; 26.8X higher Deaths: SEVERE; 23.0X higher HOW TO HELP: EVERYONE: UPDATE vaccines every 6 months WEAR N95-t... Prévisions régionales sur la COVID-19 se trouvent ici :

Nov 11, 2024 10 tweets 4 min read
Canadian COVID Forecast: Nov 9-22, 2024

SEVERE: CAN, AB, BC, MB, NB, North, NS, ON, PEI, QC, SK
VERY HIGH: NL
HIGH: none
MODERATE: none

About 1 in 31 people in Canada are CURRENTLY infected. This image shows a series of gauges with the Nov 9-22, 2024 COVID Forecast scores for Canada, the provinces, and territories. Read from left to right:  Canada: 24.1 - SEVERE Alberta: 22.3 - SEVERE British Columbia: 20.3- SEVERE Manitoba: 33.1 - SEVERE New Brunswick: 27.1 - SEVERE Newfoundland and Labrador: 13.3 - VERY HIGH North: 24.9 - SEVERE Nova Scotia: 25.6 - SEVERE Ontario: 19.9 - SEVERE Prince Edward Island: 16.4 - SEVERE Quebec: 29.3 - SEVERE Saskatchewan: 29.9 - SEVERE  All COVID Forecast input data and sources are available here: (https://covid19resources.ca/covid-hazard-index/)  F... Notre aperçu national en français :

Nov 4, 2024 7 tweets 4 min read
INFLUENZA VS COVID-19 DEATHS IN CANADA
This thread is also available on the C-19 website, starting on page 8, for easier reading.
Risk Scenario Estimator Based on Canadian Forecast

#CovidIsAirborne #CovidIsntOver #MaskUp #YallMasking #CleanTheAir
(Liz)lookerstudio.google.com/embed/u/0/repo…Image
Image
What is the proportion of influenza deaths to COVID-19 deaths currently? Thanks for asking!

This week's illustration compares annual deaths from influenza and COVID-19 in Canada.

There are about 3,500 flu deaths each year in Canada.

From 2022 onward, there have been at least 45,000 untimely ("from") COVID-19 deaths each year in Canada.

The number of people who die from influenza each year would fill the Agnico Eagle arena in Val d’Or QC.

The minimum number of people in Canada who die prematurely from COVID-19 each year would fill the Rogers Arena (SkyDome) in Toronto.
#CovidIsAirborne #CovidIsntOver #MaskUp #YallMasking #CleanTheAir
Oct 27, 2024 13 tweets 5 min read
Canadian COVID Forecast: Oct 26-Nov 8, 2024

SEVERE: CAN, BC, MB, NB, North, NS, ON, PEI, QC, SK
VERY HIGH: NL, AB
HIGH: none
MODERATE: none

About 1 in 34 people in Canada are CURRENTLY infected. This image shows a series of gauges with the Oct 26-Nov 8, 2024 COVID Forecast scores for Canada, the provinces, and territories. Read from left to right:  Canada: 22.2 - SEVERE Alberta: 14.4 - VERY HIGH British Columbia: 24.2 - SEVERE Manitoba: 30.5 - SEVERE New Brunswick: 25.2 - SEVERE Newfoundland and Labrador: 11.8 - VERY HIGH North: 23.0 - SEVERE Nova Scotia: 20.3 - SEVERE Ontario: 20.4 - SEVERE Prince Edward Island: 22.6 - SEVERE Quebec: 27.6 - SEVERE Saskatchewan: 28.7 - SEVERE  All COVID Forecast input data and sources are available here: (https://covid19resources.ca/covid-hazard-in... Notre aperçu national en français :

Oct 9, 2024 4 tweets 9 min read
With the transition of Canadian COVID-19 reporting to the combined respiratory virus dashboard, weekly COVID-19 deaths for Canada are no longer publicly reported by @GovCanHealth .

According to the most recent report, participating provinces reported 971 hospitalizations and 131 deaths for the period from Aug 25-Sep 28/24.

During the same period, Quebec, which accounts for 22% of the Canadian population, reported 4,691 hospitalizations and 256 deaths (current INSPQ data).

If hospitalizations and deaths are similar in Quebec and the rest of Canada (likely), the national report for the Aug 25-Sep 28/24 period should include at least 21,323 hospitalizations and 1,164 deaths.

Based on the most recent @CIHI_ICIS reporting of Quebec in-hospital COVID-19 deaths (Apr 1/22 to Mar 31/23), there were 1.28 times more documented COVID deaths in QC hospitals than were reported by INSPQ for the same period. However, CIHI captured only 84% of INSPQ-reported hospitalizations in QC for this period, meaning QC in-hospital deaths were likely ~1.52 times higher than deaths reported by INSPQ.

About 70% of all deaths in QC occur in hospitals (StatsCan), meaning actual COVID deaths were likely ~2.17 times higher in QC than reported by INSPQ, at least from Apr 1/22 to Mar 31/23.

Is QC reporting only "from" COVID deaths and excluding deaths of people who would have died anyway from other causes?

To test this, we can compare excess mortality estimates from @StatCan_eng for the same period, after correcting them to remove excess mortality attributable to toxic drug deaths and excess cancer deaths (stand-in for potential excess mortality attributable to delays in access to healthcare and MAID).

The StatsCan excess mortality program has been paused for the last 10 months, so estimates for QC are only available up to Sep 2/23, and are still incomplete for weeks before this date.

However, weekly age-adjusted per capita all-cause mortality rates for QC and other provinces are still published every month, meaning weekly excess mortality can still be estimated by comparing weekly mortality rates in one year to mortality rates in the same week of the preceding year, and using these ratios to estimate current excess mortality values compared to previous years when estimates are more complete.

From Apr 1/22 to Mar 31/23, there were 2.19 times more excess deaths in Quebec than reported COVID deaths, after adjusting for excess mortality attributable to toxic drugs and cancer.

This is very close to the CIHI-based estimate of actual COVID-19 deaths (2.17 times higher than reported by INSPQ for Apr 1/22 to Mar 31/23).

Taking the average of both methods for estimating under-reporting in QC, we know that for the year ending Mar 31/23, INSPQ reported 46% of "excess/from" COVID-19 deaths.

If we assume the magnitude of under-reporting of COVID-19 deaths by Quebec was similar after Mar 31/23, then from Aug 25-Sep 28/24 there were likely 558 excess/from COVID-19 deaths in Quebec, and 2,537 COVID-19 deaths in Canada.

Recall, the total number of COVID-19 deaths in Canada from Aug 25-Sep 28/24 reported on the new respiratory virus surveillance dashboard from PHAC: 131

So, it's likely that the new national COVID-19 dashboard is reporting, ~5% of "excess/from" COVID-19 deaths in Canada.

However, reporting of COVID-19 deaths by Quebec has actually worsened since Mar 31/23.

How do we know this? Because from Apr 1/23 to Jun 8/24 (the last date when age-adjusted all cause mortality rates are available from StatsCan), there were 6.37 excess deaths for every COVID-19 death reported by INSPQ, after adjusting for excess mortality attributable to toxic drugs and cancer.

So, from April 1/23 onward, Quebec has likely been reporting only 16% of its COVID-19 deaths.

If the under-reporting rate for Aug 25-Sep 28/24 was the same as for Apr 1/23 to Jun 8/24, then there were likely 1,630 "excess/from" COVID-19 deaths in Quebec from Aug 25-Sep 28/24, and 7,407 "excess/from" COVID-19 deaths in Canada during the same period.

Recall, the total number of COVID-19 deaths in Canada from Aug 25-Sep 28/24 reported on the new respiratory virus surveillance dashboard from PHAC: 131

So, it's likely that the new national COVID-19 dashboard is reporting, fewer than 2% of "excess/from" COVID-19 deaths in Canada for the 2024 respiratory virus season to date.

And no, Canada doesn't have exceptionally high COVID-19 mortality rates.

From December 2021 to March 2023, the estimated median weekly COVID-19 infection fatality rate for Canada was 4% LOWER than the median infection fatality rate for the UK calculated from ONS infection estimates and confirmed COVID-19 deaths, even though Canada is slightly older than the UK and has had lower rates of fresh vaccine dose uptake than the UK from 2022 onward.

What was the median weekly SARS-CoV-2 infection fatality rate for Canada during this period? 0.08747%

What was it in the UK? 0.08824%

Open access ref for UK IFRs: ncbi.nlm.nih.gov/pmc/articles/P…

Why are so few of Canada's COVID-19 deaths reported?

It's likely that at least in part it's because many/most(?) provinces now only report deaths in people infected for the first time, as @sarperotto has confirmed for BC via official communications from BCCDC.

From Dec 4/21 to date, the average person in Canada has had ~3.5 SARS-CoV-2 infections. Reporting only deaths associated with first time infections would reduce reporting by ~70%....meaning only ~30% of deaths would have been reported if this policy was in place in every province.

On top of that, testing in Canada during Omicron has declined ten times more than the decrease in infection and fatality rates, meaning that a substantial number of deaths and hospitalizations simply wouldn't be detected because of under-testing.

So, it's probably a combined issue of under-reporting and under-testing, but either way, it's an enormous problem.

As the Office of Canada's Chief Science Advisor Dr. Mona Nemer @ChiefSciCan has pointed out, Canada currently has gaps in the effectiveness of our communication about COVID-19 vaccines. Fewer than 15% of people in Canada got fresh doses in the fall 2023 campaign.

Perhaps if we started reporting more than 2% of actual COVID-19 deaths on our new national respiratory virus reporting dashboard people would better understand why getting a fresh vaccine is so important, and journalists would have real numbers they can use to help communicate about the issue.

I don't know who else to copy in on this post--it's like shouting into the wind, and I don't know what it will take for Canada and ALL provinces to start improving actual COVID-19 deaths and hospitalizations.

@picardonhealth @NightShiftMD @DrGorfinkel maybe you can help resurrect a national conversation on this topic.Image Should also copy in @CBCQueensPark, who's still following official public communication about COVID-19 vaccines, or rather, the near absence of official communication about their importance.

Sorry for the oversight, Mike.
Sep 29, 2024 13 tweets 4 min read
Canadian COVID Forecast: Sep 28-Oct 11, 2024

SEVERE: CAN, BC, MB, NB, North, NS, ON, QC, SK
VERY HIGH: NL, PEI
HIGH: AB
MODERATE: none

About 1 in 38 people in Canada are CURRENTLY infected. This image shows a series of gauges with the Sep 28-Oct 11, 2024 COVID Forecast scores for Canada, the provinces, and territories. Read from left to right:  Canada: 16.3 - SEVERE Alberta: 9.2 - HIGH British Columbia: 15.9 - SEVERE Manitoba: 20.2 - SEVERE New Brunswick: 23.6 - SEVERE Newfoundland and Labrador: 13.6 - VERY HIGH North: 16.0 - SEVERE Nova Scotia: 20.4 - SEVERE Ontario: 15.2 - SEVERE Prince Edward Island: 11.9 - VERY HIGH Quebec: 19.5 - SEVERE Saskatchewan: 18.6 - SEVERE  All COVID Forecast input data and sources are available here: (https://covid19resources.ca/covid-hazard-inde... Notre aperçu national en français :

Sep 29, 2024 16 tweets 6 min read
Canadian COVID Forecast Sep 28-Oct 11, 2024

CANADA

SEVERE (decreasing)

Estimated infections this week: 962,700-1,097,900

About 1 in every 38 people infected

Compared to lowest point of pandemic in Canada:

-Infections ~16X higher
-Long COVID ~15X higher
-Hospitalizations ~15X higher
-Deaths ~17X higherThis image describes the Canadian COVID Forecast for Sep 28-Oct 11, 2024 by COVID-19 Resources Canada. Canada’s COVID Forecast outlook is SEVERE (decreasing) with a COVID INDEX SCORE of 16.3 About 1 of every 38 people is infected. Estimated infections this week: 962,700-1,097,900 How much higher are key indicators compared to the lowest point in the COVID pandemic in Canada? Waste water, infections: SEVERE; 16.4X higher Long COVID estimate: SEVERE; 15.3X higher Hospitalizations, ICU: SEVERE; 15.4X higher Deaths: SEVERE; 16.9X higher HOW TO HELP: EVERYONE: UPDATE vaccines every 6 months WEAR... Prévisions régionales sur la COVID-19 se trouvent ici :

Sep 28, 2024 15 tweets 9 min read
School Classrooms and Masks and Air Image School Classrooms and Masks and Air
Last week we offered a cornucopia of information about infection risks in the classroom.

This week we’re using the same data, and presenting a clear picture of the best ways to keep everyone safer while they are in school.

-FYI- This thread is also available on the C-19 website, starting on page 8, for easier reading.

lookerstudio.google.com/embed/u/0/repo…
Sep 15, 2024 18 tweets 7 min read
Prévisions de COVID pour le Canada : SEP 14-27, 2024

CANADA

GRAVE (en baisse)

Infections pendant cette période : 1 031 400-1 095 400

Environ 1 personne sur 37 est infectée

Par rapport au point le plus bas de la pandémie au Canada :

-Infections ~18X 🔺
-COVID longue ~18X 🔺
-Hospitalisations ~17X 🔺
-Décès ~22X 🔺Image The english version of our regional forecast can be found here:

Sep 1, 2024 4 tweets 7 min read
A few things that might help people understand differences in Canadian COVID Forecast scores across provinces....

I'll focus on comparing Alberta and British Columbia, since I get asked a lot why Alberta's scores aren't as high as BC scores in the summer, even though the provinces are adjacent.

In BC, most people live in parts of the province with winters that are considerably warmer than most provinces in Canada, including Alberta.

Even southern Alberta has MUCH colder winters than the BC lower mainland, and cooler spring and fall too. I know. I've lived in both the BC lower mainland and Calgary, and couldn't get over how summer in Calgary didn't seem to really start until July.

This graph shows infections/100K people per day in BC (pink), AB (teal) and Canada (blue) since Dec 4/21.

All provinces have essentially had the same number of infections since then--the timing of when they happened just differs.

Something you'll notice about BC is that fall/winter waves often aren't as big as in Alberta or the rest of Canada.

But....infection waves are bigger in BC from spring-summer.

This is likely because infections don't start taking off till mid-summer in other provinces because there's immunity from the fall-winter infections that hasn't worn off enough until then so that people are susceptible to a new infection.

It's sort of like the brakes have been applied to new infections after the big fall/winter wave in most province, and the pressure on those brakes starts getting lighter toward mid-summer, when infections pick up again.

It's a bit different in BC, since there historically haven't been quite as many infections in the fall/winter waves, which means the population is susceptible to new infections earlier than in colder provinces.

So, in spring and especially summer BC infections tend to take off sooner than in the rest of Canada. By contrast, in winter infections are often lower in BC.

I think we're basically seeing seasonal forcing of infections in most provinces that doesn't affect BC as much because most of the population lives in a more temperature climate.

In most of Canada, there has always been a strong seasonal forcing effect on influenza seasons--stronger than in many more temperature countries, and I suspect that's what we're seeing in most Canadian infection data except those from BC.Image Scores can also differ between provinces because of intrinsic differences in population susceptibility to serious outcomes.

Alberta is the youngest province in Canada, and now that uptake of fresh vaccine doses is abysmal across Canada (AB had higher uptake than ON this past season, for example), differences in things like infection fatality and hospitalization rates between provinces are strongly driven by things we can't control, like the average age of the population and rates of underlying health issues.

So, even if AB and BC had exactly the same number of infections in the same week, the Forecast score for Alberta would be slightly lower than the score for BC, because Alberta is younger than BC.

It's also why scores for some Atlantic provinces, particularly Newfoundland and Labrador can be a fair bit higher than the Canadian average.

Newfoundland and Labrador is particularly strongly affected by this because the population is considerably older, plus higher rates of underlying health issues, plus an acute healthcare system that doesn't function quite as well as in big provinces at treating things like heart attacks (probably translating also to treatment of COVID).

And smaller provinces have suffered from poaching of healthcare staff to larger provinces that can pay more.

So, it's not always just about number of infections either. Populations differ in their susceptibility to COVID, and outcomes per infection in Canada range from the highest number of serious outcomes per infection in NL and the lowest in Alberta.

Hope this helps.
Sep 1, 2024 17 tweets 6 min read
Canadian COVID Forecast Aug 31-Sep 13, 2024

CANADA

SEVERE (increasing)

Estimated infections this week: 1,183,400-1,350,800

About 1 in every 32 people infected

Compared to lowest point of pandemic in Canada:

-Infections ~25X higher
-Long COVID ~26X higher
-Hospitalizations ~20X higher
-Deaths ~18X higherThis image describes the Canadian COVID Forecast for Aug 31-Sep 13, 2024 by COVID-19 Resources Canada. Canada’s COVID Forecast outlook is SEVERE (increasing) with a COVID INDEX SCORE of 21.0 About 1 of every 32 people is infected. Estimated infections this week: 1,183,400-1,350,800 How much higher are key indicators compared to the lowest point in the COVID pandemic in Canada? Waste water, infections: SEVERE; 24.6X higher Long COVID estimate: SEVERE; 26.2X higher Hospitalizations, ICU: SEVERE; 20.4X higher Deaths: SEVERE; 18.1X higher HOW TO HELP: EVERYONE: UPDATE vaccines every 6 months WE... Prévisions régionales sur la COVID-19 se trouvent ici :

Sep 1, 2024 23 tweets 9 min read
Canadian COVID Forecast: Aug 31-Sep 13, 2024

SEVERE: CAN, AB, BC, MB, NL, North, NS, ON, SK
VERY HIGH: NB, PEI, QC
HIGH: none
MODERATE: none

About 1 in 32 people in Canada are CURRENTLY infected. This image shows a series of gauges with the Aug 31-Sep 13, 2024 COVID Forecast scores for Canada, the provinces, and territories. Read from left to right:  Canada: 21.0 - SEVERE Alberta: 17.6 - SEVERE British Columbia: 28.0 - SEVERE Manitoba: 21.3 - SEVERE New Brunswick: 13.3 - VERY HIGH Newfoundland and Labrador: 20.4 - SEVERE North: 20.8 - SEVERE Nova Scotia: 23.4 - SEVERE Ontario: 24.1 - SEVERE Prince Edward Island: 11.9 - VERY HIGH Quebec: 12.8 - VERY HIGH Saskatchewan: 23.4 - SEVERE  All COVID Forecast input data and sources are available here: (https://covid19resources.ca/covid-hazar... Notre aperçu national en français :

Aug 31, 2024 26 tweets 17 min read
A thread about COVID-19 and COVID-19 reporting in Canada, as well as about validation of our latest COVID-19 Forecast model.

It's partly motivated by the latest infection estimates for Canada.

As you can see, estimated daily infections in Canada are currently at or nearing the highest Omicron peaks to date, and there's not a fresh vaccine in sight @GovCanHealth.

We URGENTLY need a decision about vaccine approval and shots in arms yesterday, not in October, which looks like it will be far too late, unless infections keep going even higher.Image The Forecast comes out tomorrow.

I'm just posting a bit of a rant/technical discussion in advance, so that @BattlingBeaver doesn't need to deal with it when she tweets the regular Forecast thread for me tomorrow. Now she can just link to it in the main Forecast thread.