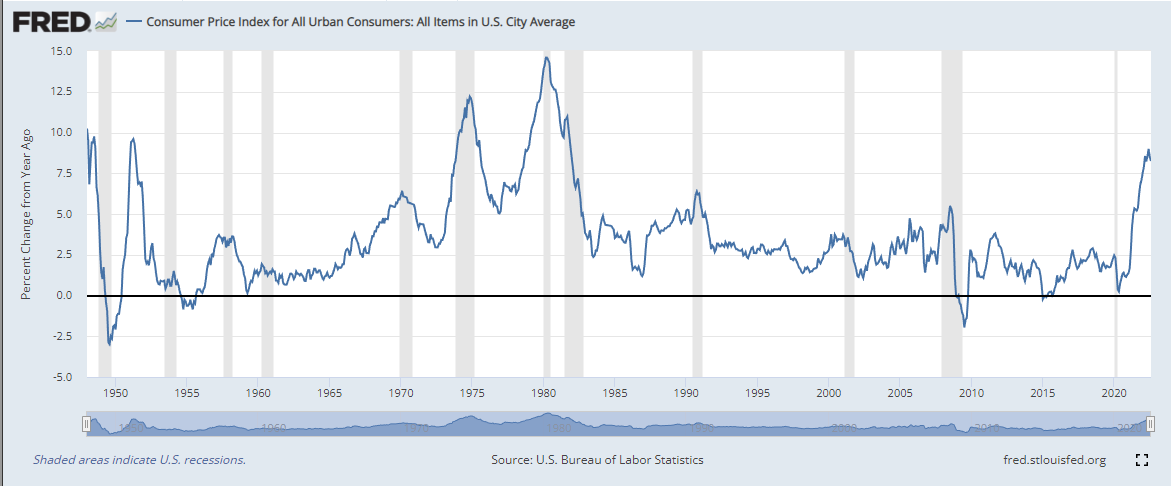
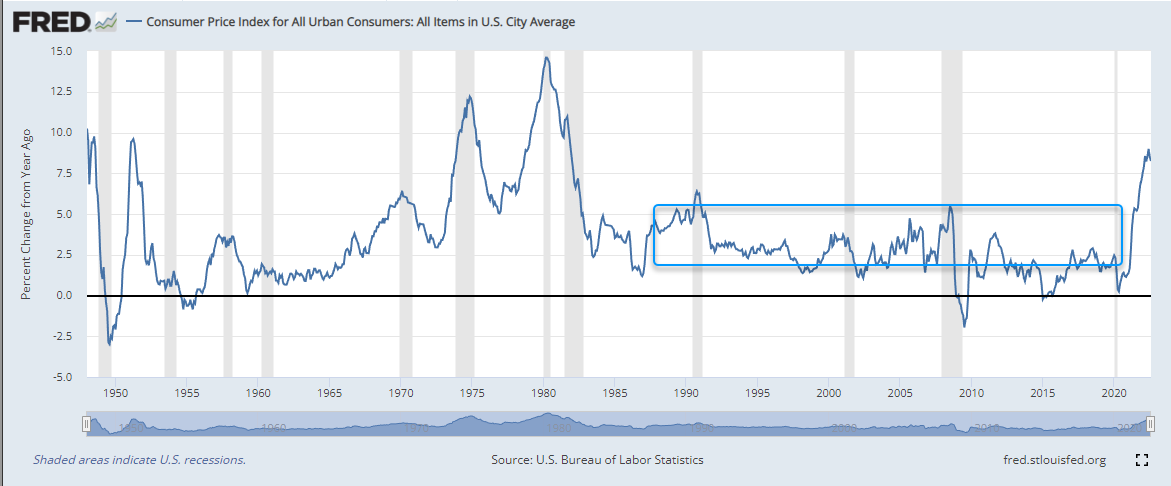
Listening to people talk about inflation is a good reminder that no one knows what they're talking about because we haven't seen growth levels like this in a LONG time. Here's my thoughts in a thread 🧵 with 12 tweets in all posted in the replies:
Too many people confuse YoY growth (first chart) and the actual price index itself (second chart). On the second chart, inflation has been on a nice steady trend since the early 80s. This is the first time since then that we've gone parabolic and deviated from the trend... 


Talking heads are assuming that we are in an environment like the previous 3 decades where the YoY growth just fluctuates and eventually drops back down to moderate levels. That's the talking point and bullish narrative right now. 

But, if the YoY growth rate drops to 0%, that doesn't mean prices will drop (like we see them doing at the gas pump). It means that they're just not growing any more. The problem is that prices are still well above their multi-decade trendline. 

To get back to the normal trendline where prices were and everybody felt good about life, the price index would have to fall. The only other time we've seen the index fall significantly was during the Great Financial Crisis. 

We all know the macro environment that occurred during that small blip. The problem is that we only got to 5% YoY growth then and even that was short-lived. And that small price index drop was DEVASTATING for markets. We'd be looking for a much larger drop in the price index now. 

The problem now is that the real Fed Funds rate was highly positive before they started raising rates AND before we started ALL the prior recessions. 

Today's result jumped slightly above -6%. Despite the latest rise in the real Fed Funds rate, we've had 15 straight months that were ALL BELOW the lowest point EVER that we hit twice in 1975 and 1980. 

Inflation growth rates won't moderate until the real Fed Funds rate is positive (we learned from Arthur Burns in the mid-70s according to Powell's Jackson Hole speech) and stays strongly positive for a long time. Why?
Because this isn't the same growth rate jump we've seen in the past 3 decades. Hardly anyone has EVER seen growth rates this high in their professional career. To think CPI growth rates will behave like they have the past 3 decades is naive.
We are in a new environment where stocks and bonds yields are negatively correlated. We've seen this happen twice in past 10 years. Both times led to higher stocks. This time, yields are RISING not falling. 

I get asked a lot why I continue to put a 🐻 tag on my #MarketOutlook tweets despite these good bullish rallies throughout the year. This 🧵is why. I think bulls are thinking about inflation the same as the past 3 decades and that's just not the case
https://twitter.com/davidsettle42/status/1569533767794176000
• • •
Missing some Tweet in this thread? You can try to
force a refresh


